Blogs

News

Favorite Posts

ctodx

Discussions, news and rants from the CTO of Developer Express, Julian M Bucknall

For z-axis challenged charts, more scrolling and zooming


Of course, as soon as I start talking about some of the new features in XtraCharts, I can guarantee I'll leave somethng out. And so it was with Zooming and Scrolling. I was so taken with the 3D charting functionality that I forgot about mentioning the 2D charts and their support for zooming and scrolling.

This is, in some ways, just as it should be: I wouldn't be here nattering about XtraCharts if all I could talk about were our pie charts. Anyway, in 2D-land user interaction with charts is just as compelling as with 3D charts (wlthough notice it has been present for a while).

First of all here's a step line chart.


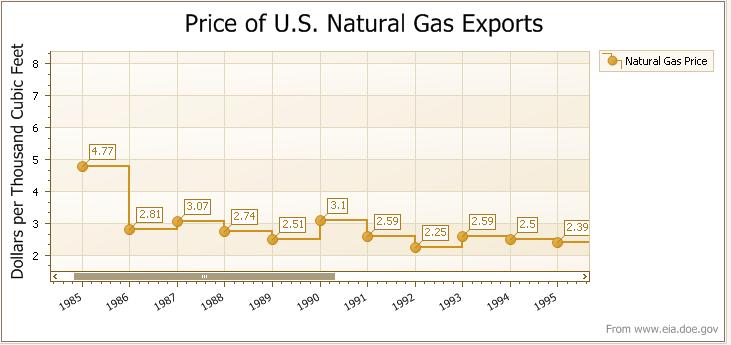
Notice that there's a scrollbar along the bottom of the chart: the graph is so wide that it does not fit in the width of the window. The scrollbar has a thumb that is equal to the proportion of the window width to the entire chart. You can scroll the chart left and right either by using this scrollbar, or, easier, by using the same click-and-grab action on the chart as you could with the 3D charts.


And zooming is just as easy: use the mouse wheel. Roll back to zoom out, roll forward to zoom in. You can also use the shift key in combination with the mouse: press shift, click the left mouse button, and then drag a region. That region then occupies the entire window.


If you zoom in, oc course, it's likely that the vertical axis will also get a scrollbar to indicate that you can scroll up and down as well as left and right.

So, again, your users gain more control over the presentation and use of your charts, and in very intuitive ways.

Next time: Gantt charts for sure.

Published Jul 17 2007, 11:12 PM by Julian Bucknall (DevExpress)
Filed under: ,
Technorati tags: v2007.2, XtraCharts
Bookmark and Share

Comments


Ganesh Muthuvelu said:

Hello DevExpress Team,

If XtraCharts can do all that MS Office Web Components (OWC) can do, then that's it.. It will be the best. Some of the MANY that XtraCharts cannot do whereas OWC  can do are (ALL NATIVELY WITHOUT ANY CODE):

1) The ability to do a run time filter on any number of flelds.

2) The ability to have ANY number of fields in the category and value axes.

3) The ability to expand/collapse portion of the charts to drill into the details.. For example, you can expand the year 1985 and see what the details are whereas the other years will remain collapsed..

4) There are so so MANY that OWC can do at run time without ANY coding that XtraCharts CANNOT do even with coding.. Now that MS does not want to uprgade OWC and plans to discontinue it, it will be a great ooportunity for DevExpress to provide more and more features to XtraCharts .. What  more features?.. Just compare it with OWC..

Thanks,

Ganesh

July 30, 2007 11:06 AM

About Julian Bucknall (DevExpress)

Julian is the Chief Technology Officer at Developer Express. You can reach him directly at julianb@devexpress.com. You can also follow him on Twitter with the ID JMBucknall.
More from DevExpress
Live Chat
Have a pre-sales question?
Need assistance with your evaluation?
We are here to help.
Chat is one of the many ways you can contact members of the DevExpress Team. We are available Monday-Friday between 8:30am and 5:00pm Pacific Time.
If you need additional product information, require pre-sales assistance, or want help with your order, write to us at info@devexpress.com or call us at
+1 (818) 844-3383.