WinForms Charting basics: the Radar plot
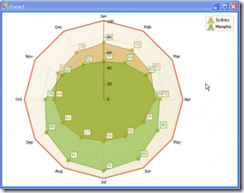
A quick video this one, part of a series on the different chart types available in XtraCharts. Here I discuss the three radar charts provided in our charting product: radar points, lines, and area.
[For some reason, it looks as if some demented two-year-old got hold of my mouse during this one; since it was me, I'm going to say my coffee must have been a tad strong that morning. Just a tad.]
Free DevExpress Products - Get Your Copy Today
The following free DevExpress product offers remain available. Should you have any questions about the free offers below, please submit a ticket via the DevExpress Support Center at your convenience. We'll be happy to follow-up.
 Julian Bucknall (DevExpress)
Recent Posts
Julian Bucknall (DevExpress)
The DevExpress Team
Julian Bucknall (DevExpress)
Julian Bucknall (DevExpress)
Julian Bucknall (DevExpress)