One of a series of posts on the new functionality that'll appear in DXperience v2009 vol 2. This is all pre-beta stuff, we're probably something like a month from beta.
This time, we'll look at the new scatter line charts in XtraCharts, again available in both WinForms and ASP.NET. The name, at least in relation to XtraCharts, is perhaps a bit of a misnomer, since scatter line charts are merely scatter charts with lines between the points. However XtraCharts doesn't contain any of these so-called scatter charts, instead, it calls them point charts, which are the same thing.
XtraCharts does have line charts already, so what's the difference between those and this new-fangled type?
The difference is subtle: line charts use an X-axis which is a category or perhaps a date range. The important thing is that the X-axis has no numerical information for the chart, it's simply a set of values. The category information from the series is spread evenly across the X-axis. Now, if your X-axis data is increasing with equal intervals between the values, it can look as if the chart is assigning meaning to the X-axis values, but in reality it's not.
A scatter chart (or, in XtraCharts, a point chart; and Excel sometimes refers to them as XY charts) is your common or garden mathematical graph, like we all drew at school. You want to graph y = x2? No problem, supply a series of (x, y) coordinates, and XtraCharts will plot them as you'd expect, with full meaning to the x values. You don't have to have all your x values at equal intervals, for example. A scatter line graph just draws lines in between the points on such an XY chart.
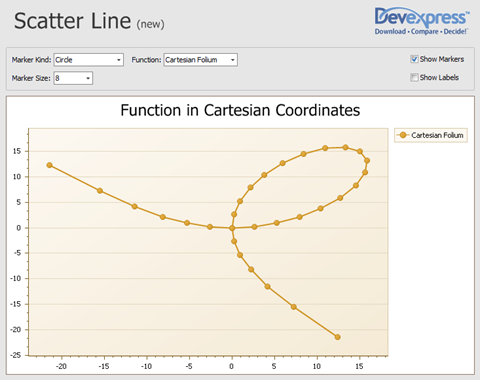
Here's an interesting graph: the Cartesian Folium, drawn as a scatter line chart in XtraCharts:

I tell you the charting devs we have have some hidden talents and knowledge. I'd never heard of this particular graph or function before and I've got a degree in mathematics. The equation of it is
x3 - 3axy + y3 = 0
for some constant a. René Descartes was the first to look at it and discuss it (hence the name), but thought the loop repeated in all four quadrants (hence its other name: fleur de jasmin, a jasmin flower having 4 petals).
Anyway, a scatter line chart in XtraCharts is merely a standard graph of a function from mathematics, physics, or engineering.
Free DevExpress Products - Get Your Copy Today
The following free DevExpress product offers remain available. Should you have any questions about the free offers below, please submit a ticket via the
DevExpress Support Center at your convenience. We'll be happy to follow-up.