One of a series of posts on the new functionality that'll appear in DXperience v2009 vol 2. This is all pre-beta stuff, it'll probably be something like the end of the month before the beta is ready.
This new feature is cool (not that the others weren't of course). It lets the chart decide how best to display a date-time scale based in the input series data and automatically specify the DateTimeMeasurementUnit and DateTimeGridAlignment properties to give the optimal display for the space constraints of the chart. Give the chart more room and the date-time scale will automatically change to a finer resolution of the data.
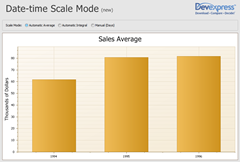
Pictures are worth more than words. Here's a bar chart showing some data by year.

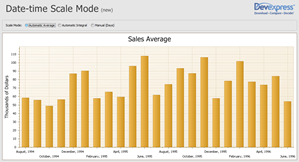
If I resize the window to give the chart more room, suddenly it'll decide that it can display the data by month instead.

This feature means that you don't have to decide a priori which date-time scale to use, or to provide an option for the end-user to switch scales. XtraCharts will do the heavy lifting.
Free DevExpress Products - Get Your Copy Today
The following free DevExpress product offers remain available. Should you have any questions about the free offers below, please submit a ticket via the
DevExpress Support Center at your convenience. We'll be happy to follow-up.