One of a series of posts on the new functionality that'll appear in DXperience v2009 vol 2. This is all pre-beta stuff. The beta will be released to DXperience Enterprise and Universal customers at the beginning of July.
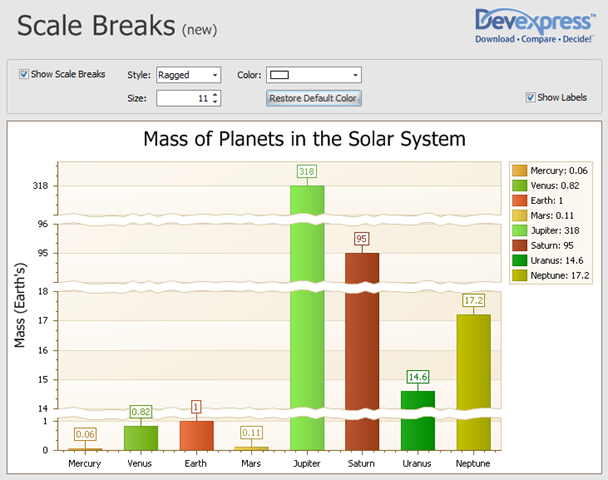
This particular new feature has been requested for a while and is essential for bar charts or line charts where the point coordinates for the Y-axis vary widely (or maybe wildly).

Certainly you can use logarithmic scales to bring the coordinates into control or into view, but the interpretation of and relationships between the data points become a little more difficult. Scale breaks divide up the axis in to disjoint "bands", so that you can still get some understanding of how the data differs. Note that there can still be some difficulty, but it's a different quality than from trying to interpret logs.
Of course, using neither logs or scale breaks means that the "large" data overpowers the "small" data, which could be, in itself, difficult to interpret (imagine the above chart as a normal bar chart: the bar for Jupiter would be 30 times the height of that of the inner four planets, dominating the chart, and it would be then hard to understand the relationship between the inner four's data).
Free DevExpress Products - Get Your Copy Today
The following free DevExpress product offers remain available. Should you have any questions about the free offers below, please submit a ticket via the
DevExpress Support Center at your convenience. We'll be happy to follow-up.