With the release of CodeRush 13.1, we have made several significant enhancements to improve the Visual Studio debugging experience, shedding more light on some of the more challenging-to-discern aspects of debugging.
XAML Bindings in Silverlight 5
Now when stepping through Silverlight 5 XAML binding code you’ll see previews of the binding properties. Gone is the need to bring up the Locals window, open the BindingState object, and then find and open the FinalSource property. Now the information you need is right where you’re looking – in the code.

Instantly see binding properties without looking away from the code, reaching for the mouse, or pressing excessive keystrokes.
Improved Support for Exceptions and the Call Stack
To make finding bugs even easier we’ve added the Call Stack and Exceptions (CS&E) tool window. While at first it may appear to be simply an easier way to read call stacks, like CodeRush itself, it’s more than a pretty face. It is especially handy when debugging asynchronous code.
To show how useful it is, first let’s look at the typical Visual Studio asynchronous code debugging experience. We’ll measure the impact on usability along the way – if this gets too crazy for you, you can jump ahead to the “Now let’s try it with CodeRush…” section below.
Async Debugging Experience in Visual Studio (without CodeRush)
First the exception is thrown. Visual Studio stops execution here:

VS Usability Impact so far: 1 target area visually scanned, 3 seconds invested
Hmm. That’s not very helpful. Of course, Visual Studio also presents this dialog:
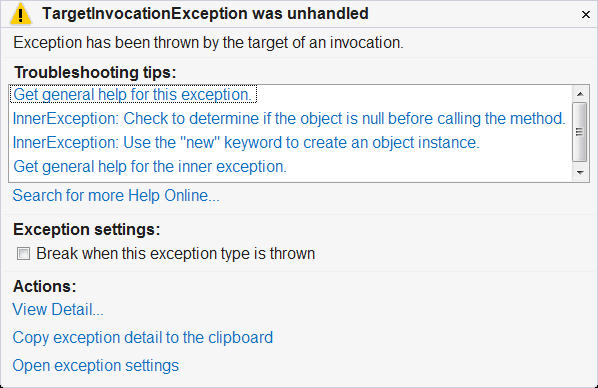
Where’s the useful information? We have no indication of what code caused the problem.
VS Usability Impact so far: 2 target areas visually scanned, 7 seconds invested
Next you look at the call stack. It looks like this:

Also, not useful.
VS Usability Impact so far: 3 target areas visually scanned, 11 seconds invested. We’re going nowhere fast.
OK, let’s go back to that exception helper window. Let’s click the “View Detail…” link.
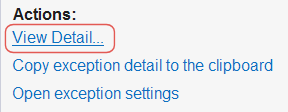
VS Usability Impact so far: 1 click, 3 target areas visually scanned, 12 seconds invested
Here comes the View Detail dialog. It looks like this:

No useful information yet. Good thing our hand is on the mouse. Move it up to the triangle and click it.
VS Usability Impact so far: 2 clicks, 4 target areas visually scanned, 14 seconds invested
Now we see this:

Scanning this data, your eyes may have noticed the InnerException. What’s that all about? Let’s open it up. Click the triangle to the left of the InnerException node.
VS Usability Impact so far: 3 clicks, 5 target areas visually scanned, 17 seconds invested
You probably have to resize and scroll to see this data.
VS Usability Impact so far: 4 clicks, 1 scroll, 5 target areas visually scanned, 20 seconds invested
The contents of that InnerException node look like this:
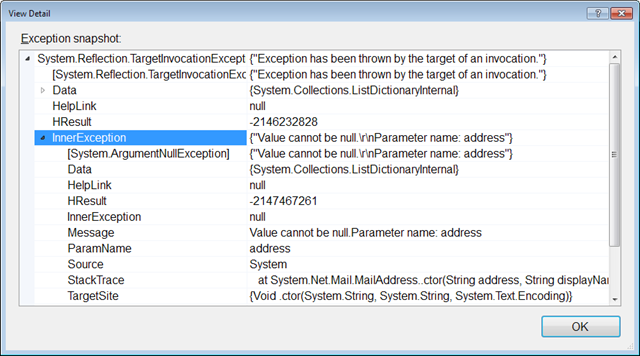
OK, so it feels like we’re getting closer. After visually scanning the InnerException child nodes, we can see three important pieces of information:

The InnerException of this InnerException is null (which means we’re near the root of the problem). The Message tells us a parameter called “address” is null, and we have a stack trace that may finally be useful.
VS Usability Impact so far: 4 clicks, 1 scroll, 6 target areas visually scanned, 26 seconds invested, and it seems we’re almost there.
Let’s open up that stack trace. First, click anywhere on that StackTrace line in the dialog. Then click on the drop down button to the right. If your Visual Studio is like mine, you’ll see something like this:

Lovely. As an exercise in futility, try to read that wrapped call stack to figure out where your problem is. There is actually more to the call stack than you see in this drop down, unfortunately there’s no scroll bar to tip you off to that fact.
After more clicking, scrolling, and reading (both above and below the visible parts of the call stack above), we might infer that our problem is at the topmost position of the call stack that references our application code:
WindowsFormsApplication1.MailSenderAsync.<SendEmail> in MailSenderAsync.cs (line 27)
VS Usability Impact so far: 7 clicks, 2 scrolls, 9 target areas visually scanned, 33 seconds invested, and it seems we’re farther away than we thought.
So now we look at the code. Since there's no navigation support built in, we need to close this stack of windows.
VS Usability Impact so far: 10 clicks, 2 scrolls, 9 target areas visually scanned, 36 seconds invested.
Next we need to get to line 27 of MailSenderAsync.cs and take a look:
VS Usability Impact so far: 11 clicks, 2 scrolls, 5 keystrokes, 9 target areas visually scanned, 41 seconds invested.

Let’s press Ctrl+Shift+Space to see the parameter tool tip for the MailAddress constructor.

Excellent! We’ve found the parameter named “address”. Getting closer.
VS Usability Impact so far: 12 clicks, 2 scrolls, 8 keystrokes, 9 target areas visually scanned, 44 seconds invested.
OK, so the “sender” parameter must be null. But how did we get here? How do we fix this? Unfortunately, after almost a full minute of clicking, scanning, and reading, we’ve only scratched the surface of understanding the problem. Typically the next step is to set a conditional breakpoint to stop when sender is null so we can investigate the call stack in more detail.
From the Usability Count we’ve been maintaining it seems we’re investing a lot of development time going nowhere. We might need to set a breakpoint and try this again, or scan the call stack from the inner exception again to find out how we got here and find out how sender is getting a null value. Even a guru developer may be several seconds, if not minutes away from discovering the answer.
Let’s compare this experience with Visual Studio on some serious family-friendly steroids, err CodeRush, plus our new CS&E window.
Now let’s try it with CodeRush…
By the way, if you already have the latest version of CodeRush installed, we recommend starting a new debug session (create new project and run it) right now and then open and dock the CS&E window at your favorite place in the editor while VS is in debug mode. This one-time step will get Visual Studio to remember this position and make sure the CS&E window is there for you in future debug sessions.
I’ll wait while you do that.
DevExpress | (CodeRush) | Tool Windows | Call Stacks and Exceptions. 
OK, ready? Here’s how easy it is to find the bug with CodeRush:
Starting with the same code and the same place as the previous example, click this link:

CR Usability Impact so far: 1 click, 1.5 seconds invested.
The CS&E window immediately looks like this:
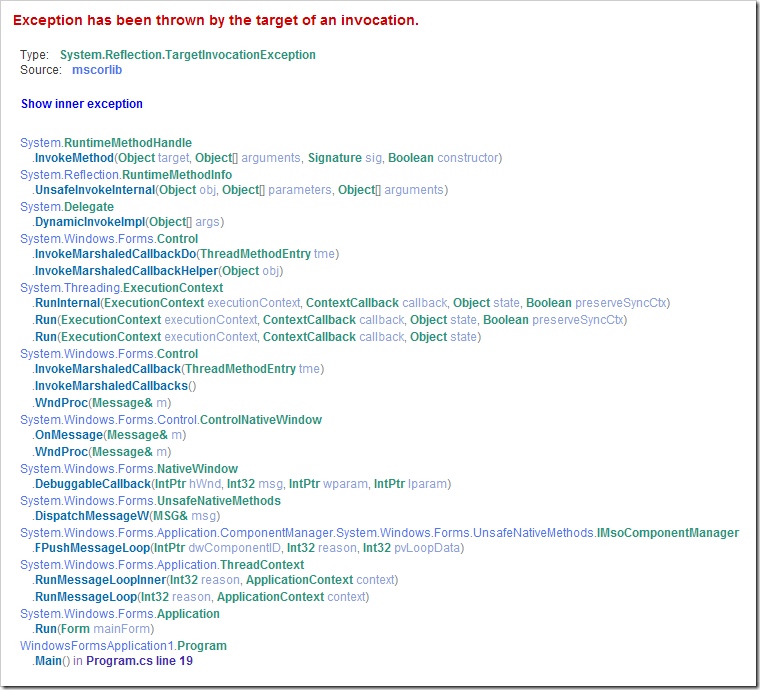
We’re debugging Async, so we know this outer call stack isn’t interesting. Instead we click the “Show inner exception” link above the stack.
CR Usability Impact so far: 2 clicks, 3 seconds invested.
Now we see this:

Do you see that? The CS&E window is ACTUALLY HIGHLIGHTING the line of code contributing to our “sender equals null” problem. No need to visually scan the call stack. Just click the “MailSenderAsync.cs line 21” link, and we’re immediately inside this code:

Are you kidding me? The Sender field variable, the parameter to the SendMail overload is ACTUALLY SELECTED. It’s actually selected, kids, drawing your eyes right onto the source of the problem, explaining how the sender parameter became null – the Sender field variable, passed into the method from line 21, was null. Now we’re much closer to understanding the problem. Nice.
CR Usability Impact so far: 3 clicks, 5 seconds invested.
When you’re debugging asynchronous code, the difference is huge. Here are the usability totals for this example:
| | | | Visual Studio (alone) | VS + CodeRush | | Clicks | 12+ | 3 | | Scrolls | 2+ | 0 | | Keystrokes | 8+ | 0 | | Areas Visually Scanned | 9+ | 0 | | Time invested | 44+ seconds | 5 seconds | |
This is good stuff. CodeRush helps you stay focused on the code instead of wasting time struggling with suboptimal UI.
Important notes about the CS&E window:
- Make sure you have the “Automatically paste exception or call stack from clipboard” button in the down state to get this seamless ease of use.

- You can copy call stacks and exception data from any location (including Visual Studio’s Call Stack window).
This last point means you can send a call stack to a team member and they can copy it to the clipboard and see it inside the CS&E window, and they can use it to explore the same version of the code, EVEN IF THEY ARE NOT DEBUGGING. Impressive.
Dead Path De-emphasis
CodeRush de-emphasizes code on dead paths (e.g., outside the current execution path). Conditional blocks that won’t be executed on the current pass are grayed out, so as you’re stepping through code it’s even easier to focus on the code that will be executed.
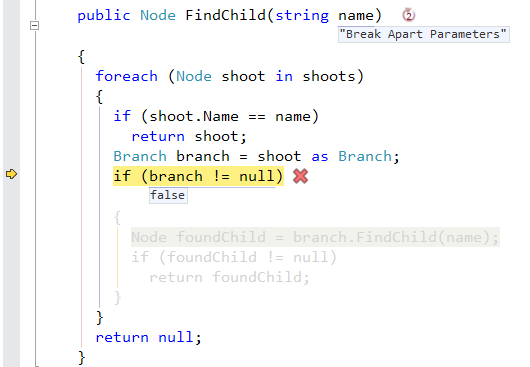
Code along the dead path (e.g., inside the conditional block) is grayed-out. We won’t be stepping into that block in this pass.
Recursive Method Depth Counter
CodeRush now displays a counter indicating the depth of recursive method calls. The counter appears when a method is called from itself at least one time.

The Recursive Method Depth counter shows how deep you are into that method’s recursive call stack.
The recursive call indicator reveals how many times the method appears on the call stack, so “2” is shown on the first recursive call.
New Actions, New Options, and Other Debug Visualizer Improvements
The following actions and default shortcuts are now available:
- Toggle Expression Values - Ctrl+Shift+Alt+F10
- Focus Next Expression - Tab
- Focus Previous Expression - Shift+Tab
- ToggleDebugVisualizer - Ctrl+Alt+D
We have added a “Show historical values” option to the “Editor | Debug | Visualizer” options page. It specifies whether to show values only for the current code line or for all code lines within the current method. I prefer seeing a full history, however you may prefer a more compact display as you work.
In Visual Basic, CodeRush now shows icons indicating whether the current Boolean expression is true or false for “case” statements.
The Debug Visualizer is smarter and able to automatically preview more expression types than before.
CodeRush smoothly adjusts line height when showing or hiding debug visualizer visual elements (expression values or Expression Explorer). This results in a smoother debugging experience and keeps your eyes on the important data.
Free DevExpress Products - Get Your Copy Today
The following free DevExpress product offers remain available. Should you have any questions about the free offers below, please submit a ticket via the
DevExpress Support Center at your convenience. We'll be happy to follow-up.