We are happy to announce yet another little improvement in the next version of the XtraReports Suite(v2011 vol 2) - the ability to debug report scripts in Visual Studio.
To enable this feature, add the following lines enclosed in the <system.diagnostics> tags to the <configuration> section of the config file of your application (or the web.config file of your ASP.NET application).
<?xml version="1.0" encoding="utf-8"?>
<configuration>
  <system.diagnostics>
    <switches>
      <add name="AllowDebugXtraReportScripts" value="true"/>
    </switches>
  </system.diagnostics>
</configuration>
Then run your application and attach Microsoft Visual Studio to this process.

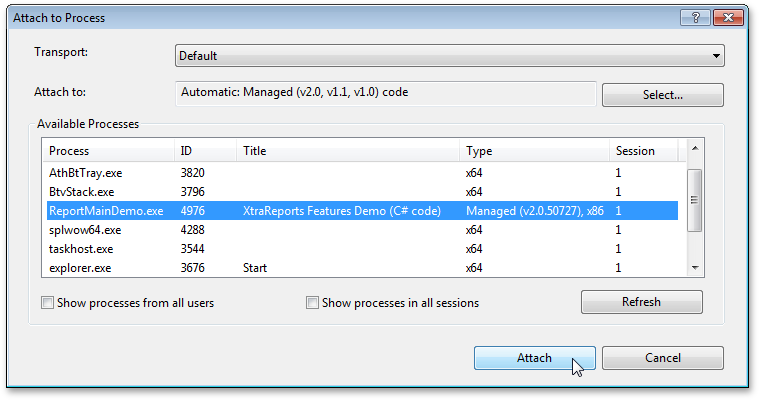
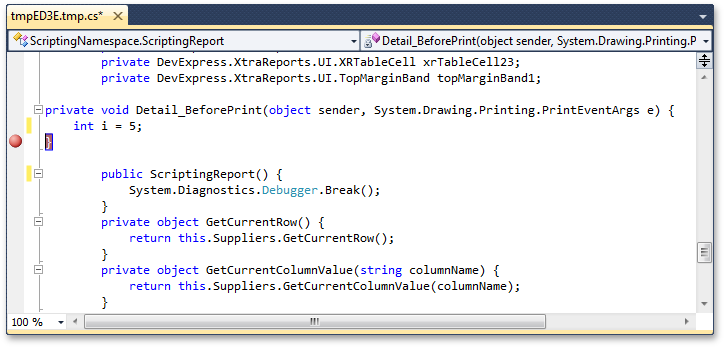
After calling the CreateDocument() method for your report (e.g. when switching to the Preview tab in an End-User Designer), the corresponding script code is available at Visual Studio runtime, and it is possible to set a breakpoint on it.
After finishing debugging your scripts, you may wish to remove all temporary files that are created to provide this functionality. They are located in the following directory: C:\Users\User_Name\AppData\Local\Temp

Free DevExpress Products - Get Your Copy Today
The following free DevExpress product offers remain available. Should you have any questions about the free offers below, please submit a ticket via the
DevExpress Support Center at your convenience. We'll be happy to follow-up.