Browse by Tags
DevExtreme Charts (v20.1) ships with enhancements to axes positioning logic. You can now locate axes at any position on a chart (not just its edge) and specify intersection point coordinates. For instance, this new feature allows you to create quadrant charts or display axes at a fixed position during scroll and zoom operations...
The DevExpress Team
15 May 2020
Early last year, we introduced annotation support to DevExtreme Charts. With our v20.1 release, we’ve extended annotation support to our Polar Chart. You can now apply text, image, or custom annotations as needed. Once you create an annotation, you can attach it to a Polar Chart element (such as a series point) or display it at specific coordinates...
The DevExpress Team
7 May 2020
As we mentioned in a previous blog post , we've added quite a number of legend/label related enhancements to our JavaScript Charts & Gauge visualization library. In this post, I will highlight another new BarGauge and Funnel chart related feature – improved...
Don Wibier (DevExpress)
1 July 2019
Thanks to great feedback from users such as yourself, we’ve extended the capabilities of our JavaScript Chart and Gauge widgets with the following new features (v19.1)...
The DevExpress Team
24 June 2019
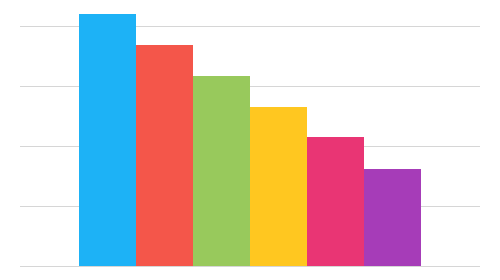
DevExtreme Data Visualization widgets made their debut back in 2013. Since then, the idea of how a modern application should look has evolved over the years. Unfortunately, our chart's default appearance remained the same.
You may have read about the new "Material" theme in the DevExtreme library. Well, we're bringing this to charts too by introducing a new "Material" palette and palette extension modes. And it looks fantastic...
The DevExpress Team
10 May 2018
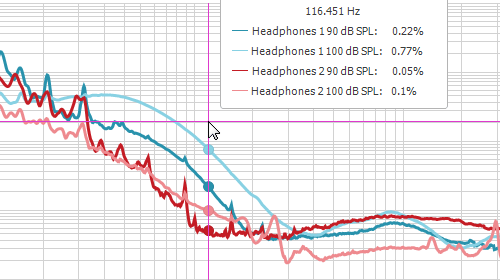
In addition to Crosshair Cursor performance improvements mentioned in our recent post about performance improvements , we extended the Crosshair functionality on the basis of some very popular customer requests. The improvements apply to WinForms Chart...
Oliver Sturm (DevExpress)
26 April 2018
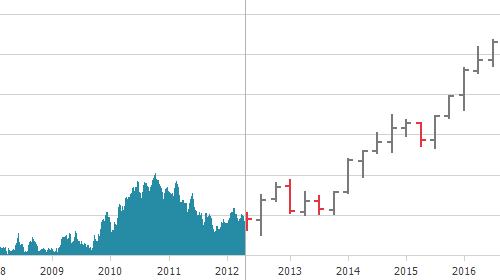
The details in this post apply to the WinForms Chart and WPF Chart controls, the WebChartControl in ASP.NET WebForms , and the control created by the DevExpress.Chart() function when using ASP.NET MVC Extensions. Additional flexibility for MeasureUnit...
Oliver Sturm (DevExpress)
20 April 2018
More Posts
Featured Posts
Paul Usher (DevExpress)
DevExpress Developer Survey — AI Impact, Regulatory Compliance, Upgrade & General Product Experience
Dennis Garavsky (DevExpress)
Alex Chuev (DevExpress)
Popular Topics
- Roadmap
- v26.2 - Next Release
- v26.1 - Latest Release
- Prerelease/EAP
- .NET 10
- AI
- Security
- DevExtreme
- Blazor
- ASP.NET
- Office File API
- XAF UI/Web API Service
- .NET MAUI
- WinForms
- WPF
- Reporting
- BI Dashboard
- VCL