DevExpress Dashboard - v18.2 and What You Can Expect in mid-November

Our v18.2 release is drawing closer and it is time to show you some of the features we have been working on. We also hope to gather some feedback, since it’s not too late yet to change things in case we forgot about something important.
Many of the features described in this post will be supported for all our target platforms:
- WinForms, WPF
- ASP.NET WebForms, MVC, Core
- HTML5/JS Web Dashboard
In a few cases, support is limited to a smaller subset of platforms. This is mentioned in the respective feature sections.
Ready to Try
Several new features are ready for you to try (see details about access to the preview below). Here’s what’s new:
Tab Support
This is a large and highly requested feature: Tabs within DevExpress Dashboards! A detailed description has been published in this blog post.
Dashboard Model
We have now published and documented Dashboard Model types for the Web Dashboard. This allows developers to create and modify dashboards and their elements from code. This has been possible from .NET code for WinForms and WPF in the past and there are many use cases: pre-populate data bindings for new items, apply default configurations like currencies or formats, react to designer events. All this can now be done from JavaScript or TypeScript!
var dashboard = dashboardControl.dashboard();
var grid = new DevExpress.Dashboard.Model.GridItem();
grid.name('grid (master filter)');
var dataSourceId = dashboard.dataSources()[0].componentName();
grid.dataSource(dataSourceId);
grid.interactivityOptions.masterFilterMode('Single');
var gridColumn = new DevExpress.Dashboard.Model.GridDimensionColumn(grid);
var dimension = new DevExpress.Dashboard.Model.Dimension();
dimension.dataMember('OrderDate');
gridColumn.dimension(dimension);
grid.columns.push(gridColumn);
grid.filterString(`[${dimension.uniqueName()}] <> 2010`);
dashboard.items.push(grid);
dashboard.rebuildLayout();
A preview of the documentation is available here. Please note that this is based on our TypeScript definitions, but it shows JavaScript in samples since it is more widely applicable. What do you think? Do you like the documentation?
We have created a knowledge base article with further details about the API: Web Dashboard Model Preview
Please feel free to post any thoughts about the API to the comments section on the Knowledge Base post!
Reload Data on the Web
On Windows client platforms it was already possible to reload data interactively, but this was technically more difficult to implement for the Web since users share data sources. Now it is possible for an end user to initiate the process of reloading data from the client side. This means that the Dashboard cache is invalidated and all Dashboard items are reloaded.
We have created a Knowledge Base entry for this feature here: Web Dashboard Reload Data Improvements
It would be very useful if you could share some details about your use cases for data reloading in the comments section on the Knowledge Base post.
Neutral Filter Mode
We have previously blogged about this feature, but it’s worth mentioning again! The Neutral Filter Mode improves usability of our filtering features by making them more efficient and removing certain “dead lock” scenarios.
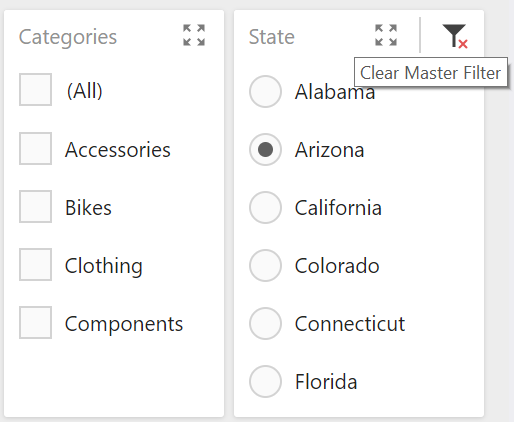
At this point we have modified our demos to use Neutral Filter Mode by default.
In the Works
In addition to those features that are ready for your scrutiny, we are currently working on a few others that we are not making available yet (but that will be in v18.2!).
Angular Integration
We found that Angular integration of our Web Dashboard was rather more complicated than it should be. We don’t offer an Angular wrapper so far, and we also don’t support modules. The lack of module support means that all client-side JavaScript frameworks, which typically use packaging systems like WebPack or SystemJS as part of the build process, have a hard time working with our Web Dashboards.
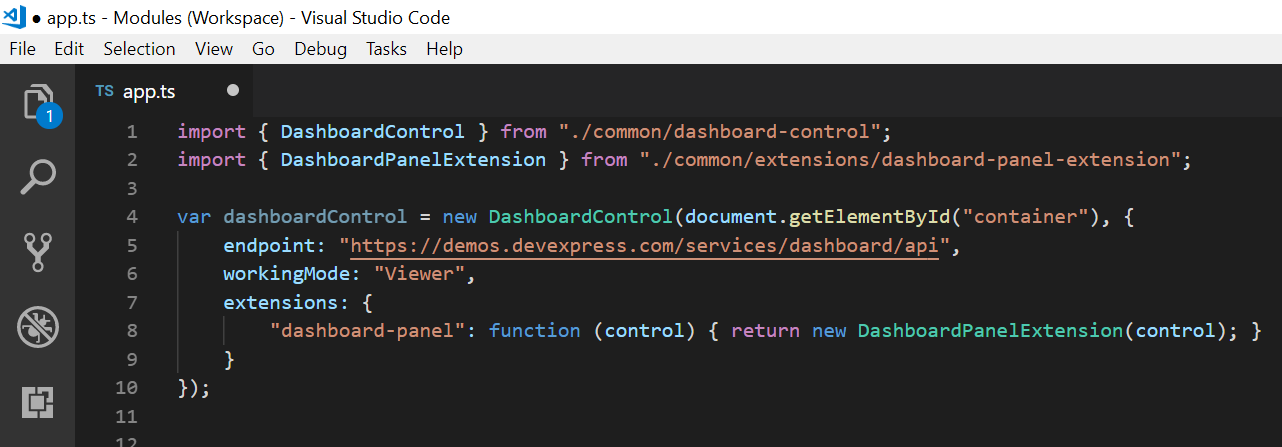
We are making good progress with our work to modularize our code, but the changes have not been finalized yet and are not currently available to test.
Localization Improvements
We are restructuring and refactoring our localization constants for the Dashboard Codebase and Localization Service, which applies to all supported platforms. This work is in progress but will be completed for v18.2.
Formats for All Numbers
This feature is not part of our 2018 roadmap, but we learned from customer feedback and usability tests that some important numbers shown in dashboards can’t be formatted as required at this time. We have therefor started a review process of all numeric and DateTime values, to ensure there are format settings applicable to them.
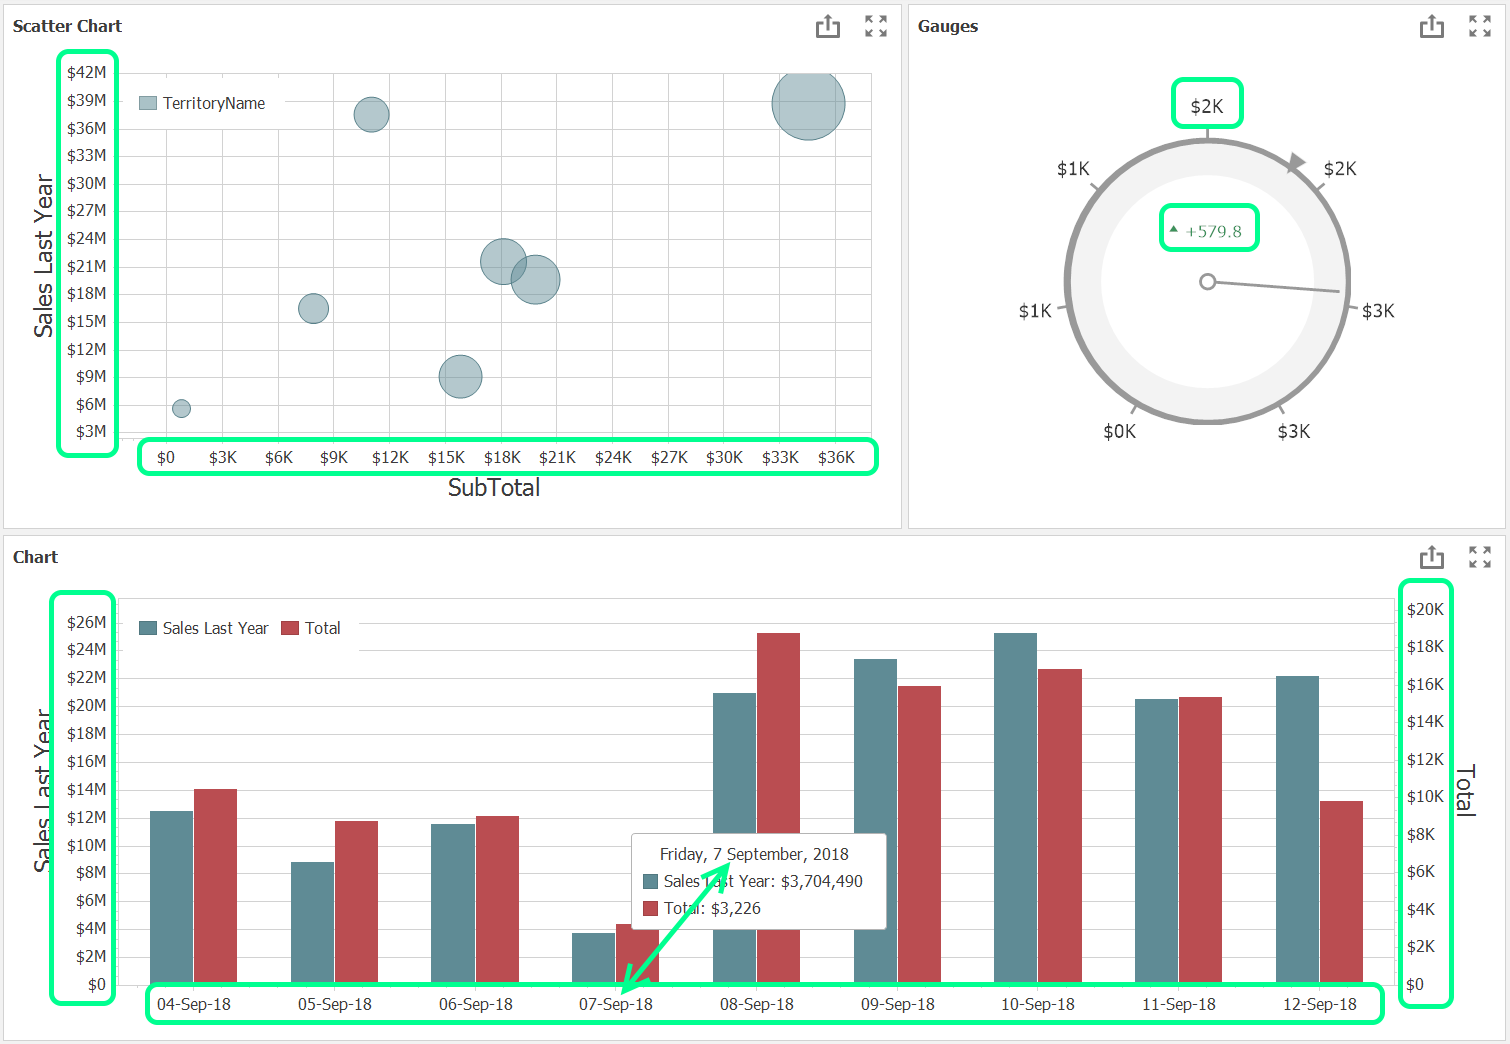
Please feel free to let us know if you have any specific values in mind that are missing formatting options so far! We are likely to catch them, but better safe than sorry.
If There’s Time…
We have one other feature in mind that we will try to include for v18.2 if time allows.
Compact Range Filter
Currently, the only way to filter data by date or number ranges is to use the Range Filter Dashboard Item. This element is intuitive, informative and visually appealing, but for some setups it is just too large. We are considering options for a more compact range selection mechanism, including a simple pair of editors as well as a Range Filter in Compact Mode. We haven’t found a perfect solution yet, so any thoughts are particularly welcome in this area!
Access to a Preview Release
If you are an active Universal subscriber and would like to test the upcoming v18.2 features prior to the official release, please email our support team at support@devexpress.com or create a private ticket in the Support Center. With that, we can verify your account and provide you with a v18.2 preview installation privately.
If you are using a trial and want to try this feature today, you can purchase a DevExpress Universal license online (this will give you access to early builds such as this CTP). If you own a non-Universal subscription and are ready to upgrade, email us at clientservices@devexpress.com for preferential upgrade pricing.
Free DevExpress Products - Get Your Copy Today
 Oliver Sturm (DevExpress)