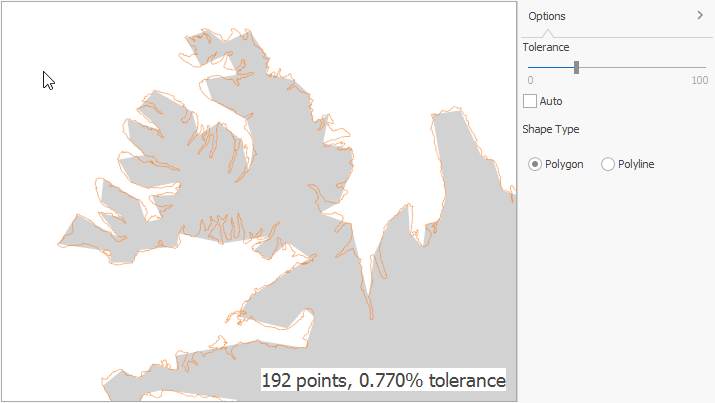
Shape Simplification
Our Map Control supports several popular vector data formats, including Shapefiles (.shp) and SVG images. We optimized our rendering engine in the past so that shapes consisting of up to 7000 segments and one million total vertices can be rendered efficiently. This covers many common use cases, and of course we are always working on further improvements.
However, some shape files may always be too large to render on certain machines, with acceptable performance. At this time, it’s not hard to find files on the Web that have more than 5 million vertices. Available processing power grows over time, but so does the complexity of shape data. The correct way to deal with this moving target is to simplify shapes as and when required.
For v19.1 we extended the MapEditor API with the method SimplifyItems. As a developer, you can call this API method at any point in time to simplify vector shapes based on a tolerance factor – e.g. while loading shape data, or when triggered interactively by the end user. Two different simplification algorithms are supported: Douglas-Peucker and Visvalingam.
Note that it is possible to use the simplification mechanisms without even creating a MapControl. The Simplify method is part of the base class and you can instantiate the DouglasPeuckerShapeSimplifier or the VisvalingamShapeSimplifier independently to call it.
SimplifyItems is implemented for the MapControls for WinForms and WPF. If you have v19.1 installed, check out these demo modules to see how the tolerance parameter takes effect. Be sure to zoom in using the mouse wheel to see the changes for high tolerance values.
GeoUtils
We added new MapEditor functionality by introducing the class GeoUtils to support the most common measurement operations, including shape perimeter and area. The Map Editor demo module shows these new features for both WinForms and WPF. Just hover the mouse over an element or click it in select mode in WPF, and the tooltip shows calculated values for perimeter and area.

The documentation for the GeoUtils Class lists all supported helper methods.
Georeferenced Images
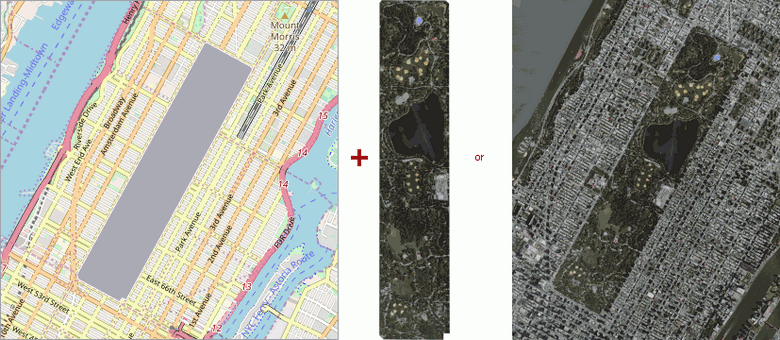
The final feature for this post is our new functionality for the WinForms MapPolygon element: it can now display raster images. Note that the WPF MapPolygon supports this as well, but it doesn’t require any special functionality from our side.
Our implementation covers two common use cases:
- A raster image matches the shape of a MapPolygon and can be displayed within the polygon boundaries without modification
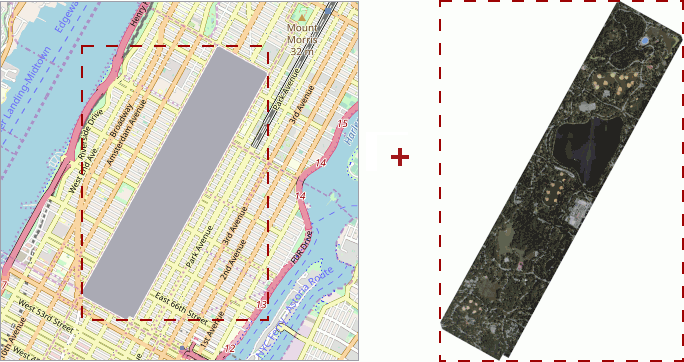
- A raster image has different proportions than the target MapPolygon and needs to be transformed. A set of mapping points specifies how the image will be mapped to the polygon surface.
Our documentation page Georeferenced Image describes in detail how to set up both scenarios at design time or from code.
If you have v19.1 installed on your machine, you can use this link to access a WinForms demo of the new feature set: Geo Shape Image (WinForms)
What about WPF?
To illustrate the same features for our MapControl for WPF, we created a a similar demo that uses the WPF ImageBrush to fill a MapPolygon with a raster image: Geo Shape Image (WPF)
To implement the second use case described above, WPF developers can use native WPF transform mechanisms. We describe this approach in the documentation article How to: Add a Georeferenced Image to a Map.
For the future we are considering ideas to add specific mapping functionality to the WPF MapPolygon, similar to the mapping points approach in WinForms. If you think this would be useful to you, please be sure to submit your responses to the short survey below.
Please Share Your Thoughts
As always, we are interested in your feedback. Please feel free to leave comments below or open Support Center tickets as required. In addition, we would appreciate your responses to this quick survey:
Webinar
Please use the link below to register for our upcoming Dashboards, Reporting & Data Analytics webinar, where all new features the the v19.1 release are demonstrated.
Register for the Dashboards, Reporting & Data Analytics v19.1 Webinar
Free DevExpress Products - Get Your Copy Today
The following free DevExpress product offers remain available. Should you have any questions about the free offers below, please submit a ticket via the
DevExpress Support Center at your convenience. We'll be happy to follow-up.