In this post, we’ll discuss a couple of features we failed to mention in our v19.2 EAP blog post. Though the functionality described herein is primarily designed for financial charting, we believe it can be of value for other usage scenarios as well.
Extended Chart Toolbar
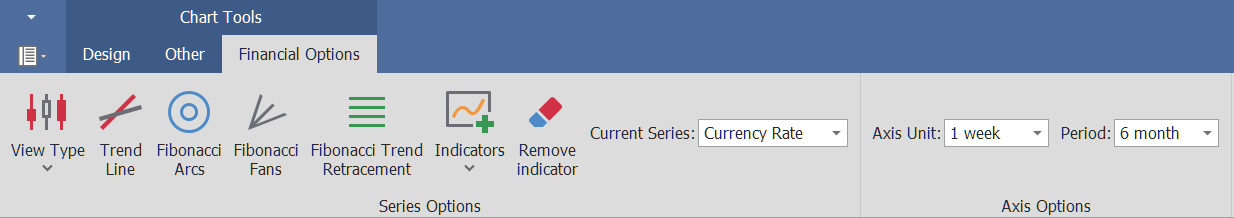
We’ve extended our existing Chart Toolbar with a set of new functions to address the following requirements:
- Change a Financial Series view
- Draw Fibonacci indicators
- Plot any technical indicator on a separate Pane
- Change the X-Axis measurement units
- Set the X-Axis visible range to a predefined interval
These new Financial toolbar options can be integrated into our WinForms Ribbon UI control…
or into our Bar Manager…

Runtime Pane Resizing
We’ve improved the runtime user experience of our WinForms Chart library with a new Pane resizing option. You can now set the XYDiagram2D.RuntimePaneResize property to True and resize Panes via the mouse – you no longer need to invoke the Chart Designer and modify Pane size manually.

These features outlined in this post will be available in our upcoming v19.2 Beta. All active Universal or DXperience subscribers will be able to download this build once released via the DevExpress Client Center.
Free DevExpress Products - Get Your Copy Today
The following free DevExpress product offers remain available. Should you have any questions about the free offers below, please submit a ticket via the
DevExpress Support Center at your convenience. We'll be happy to follow-up.