DevExpress Dashboard Roadmap 2020 – Your Vote Counts

Like last year, we've compiled a list of features we're considering for our 2020 .NET Dashboard Roadmap. Please review the list below and let us know what you'd like us to deliver in 2020.
The Past – Are we on the same page?
Before we get started, we'd like to gauge the overall effectiveness of our 2019 development efforts. To that end, please take a moment and tell us which of the following 2019 features you've used or plan to use in an upcoming project.
The Future – v20.1
API to Extend a Dashboard's Lifecycle
In our first release of 2020, we want to introduce an easy and straightforward API to extend the Dashboard's design lifecycle. Our objectives will be as follows:
- Allow you to easily add a UI for your properties within Dashboard Designers (both desktop and web).
- Allow you to add customer-related properties (aka user data) to Dashboard Items, Dashboard Items Elements (Columns, Cards, Series) and possibly to Data Items (scope and dimensions have yet to be defined).
We will store your custom data within the model and automatically manage serialization/deserialization as needed. We will also pass *extended context* to Dashboard Control event handlers:
-
Dashboard item model;
-
Custom data in a simple and accessible form.
Step 1: Add Metadata for the custom properties.
ChartItem.addCustomProperty({
    propertyName: 'scaleBreaks',
    displayName: 'Custom Setting - Scale Breaks',
    editor: DevExpress.Dashboard.Metadata.editorTemplates.buttonGroup,
    valuesArray: [ {
        value: true,
        displayValue: "Enabled"
    }, {
        value: false,
        displayValue: "Disabled"
    }]
});
onItemWidgetCreated: (args) => {
    if (args.customProperties.scaleBreaks) {
        var widget = args.getWidget();
        var valueAxisOptions = widget.option("valueAxis");
        valueAxisOptions[0].autoBreaksEnabled = true;
        widget.option("valueAxis", valueAxisOptions)
    }
},
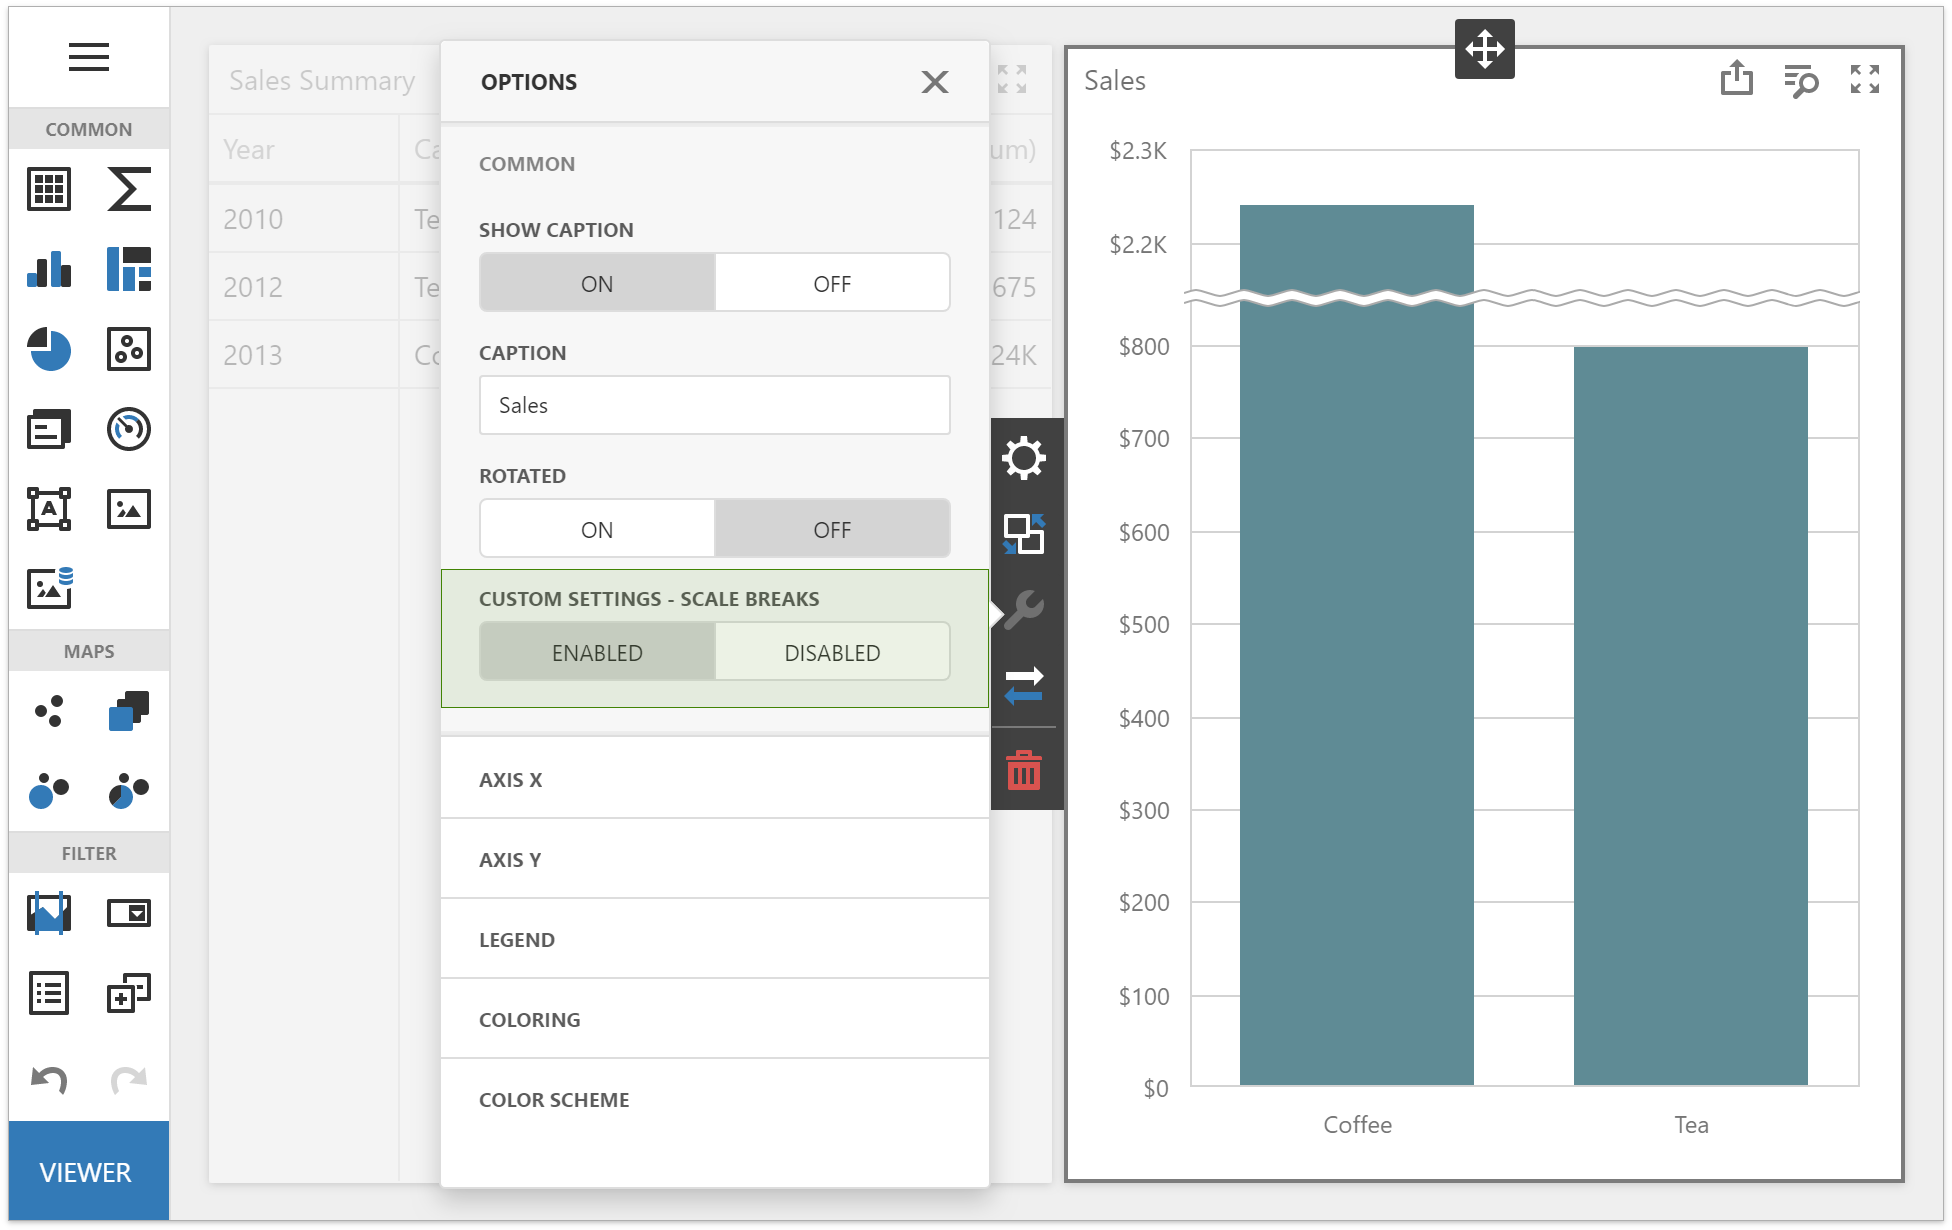
Your users can now specify the Custom Property in the Dashboard Designer.
Parallel Periods

Parallel periods are an important data analysis tool. Though we allow you to address simple usage scenarios in this regard, complex scenarios are not currently supported (when comparing the same data against different date periods). We want to address complex usage scenarios in our v20.1 release and introduce Missing Values data preparation support to improve overall functionality.
Card Item Conditional Formatting

We'd like to introduce conditional formatting to our Dashboard's Card Item. With this feature, end-users will be able to create conditional formatting rules within the Designer via the same UI used by our Grid/Pivot Grid.
This feature will allow you to configure visual warnings/alerts/notifications when values fall within a specific range (and inform users if actions are required).
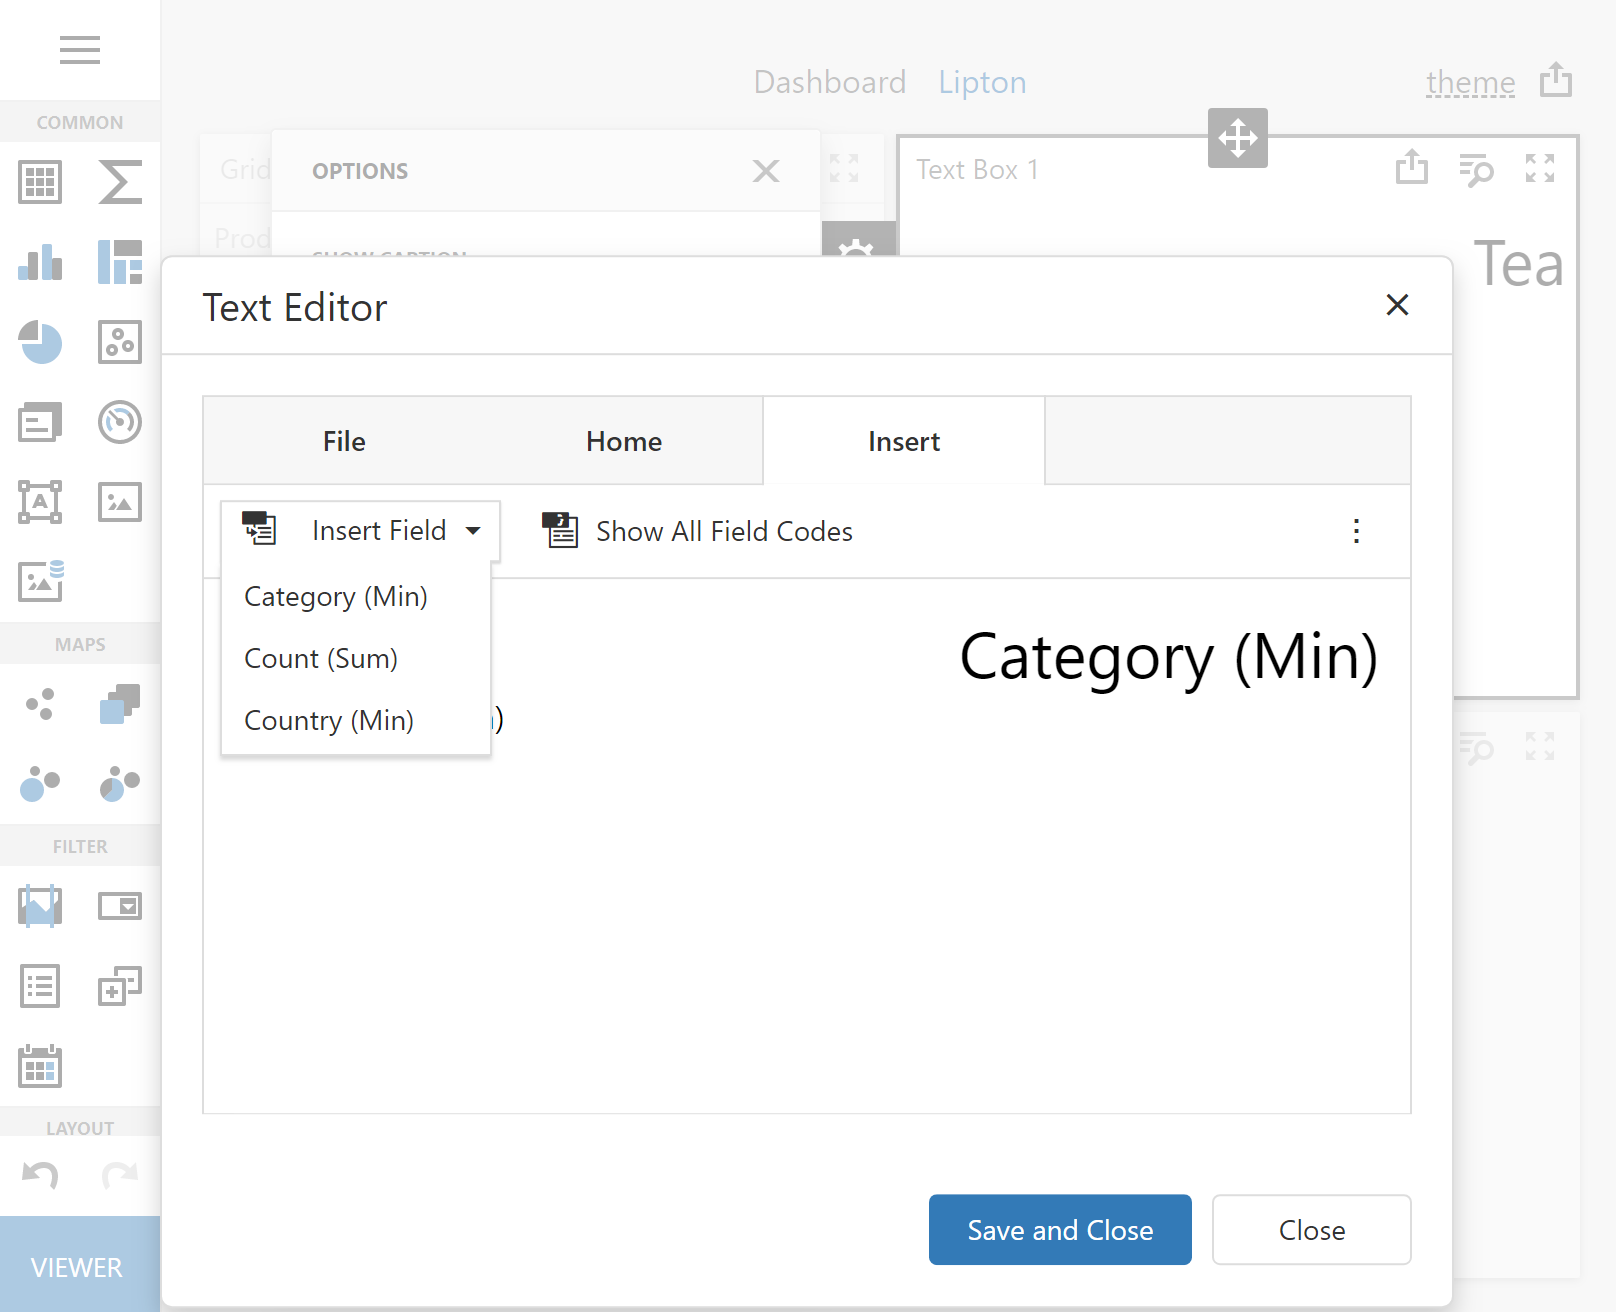
Text Box – Improved Web Dashboard Data Binding
Tab Item Performance Enhancements
We want to limit Dashboard Item loading to active tabs. This feature will help improve overall performance when using multiple Dashboard Tabs (with Dashboard Items that require heavy data processing).
Year-Week Date Group interval
Some of you have asked us for this visualization option (for your DateTime scale - when grouping per Day is too narrow and grouping per Month is too wide).
Though most requests related to charting, we believe this grouping option will be useful to multiple Dashboard Items.
You can implement similar functionality in the current version using double Argument grouping, but this approach has visualization and master-filtering limitations.
Web Dashboard – Improved Exception Handling and Processing
At present, we consider every exception thrown on the sever to be "unsafe" because such exceptions may contain logins, passwords, file paths and other sensitive data. We never pass any exception messages to the client when your Web.config file is configured to display "custom error pages." This approach is recommended by Microsoft for both ASP.NET and ASP.NET Core platforms.
Though the safest option, we found that some of you wish to pass error messages to the client and display those messages to your end users (for example, an error caused by an incorrect calculated field expression, a malformed filter expression, missing data-related issues).
The Future – v20.2
Web Dashboard with Framework-specific wrappers

Though the exact scope has yet to be defined, we hope to optimize DevExpress Dashboard so that it creates and processes events based on the web framework used.
Chart Conditional Formatting
With conditional formatting, Dashboard Charts will be able to highlight values that corresponds to specific criteria and allow you to add marks to corresponding Argument labels.
Chart and Scatter Chart Item – Constant Lines
End-users will be able to add constant lines to a Chart Item (at present, we only offer API methods). Constant lines help users interpret chart data more effectively (whether chart values fall within an expected/desired range).
Chart Item – Trend Lines
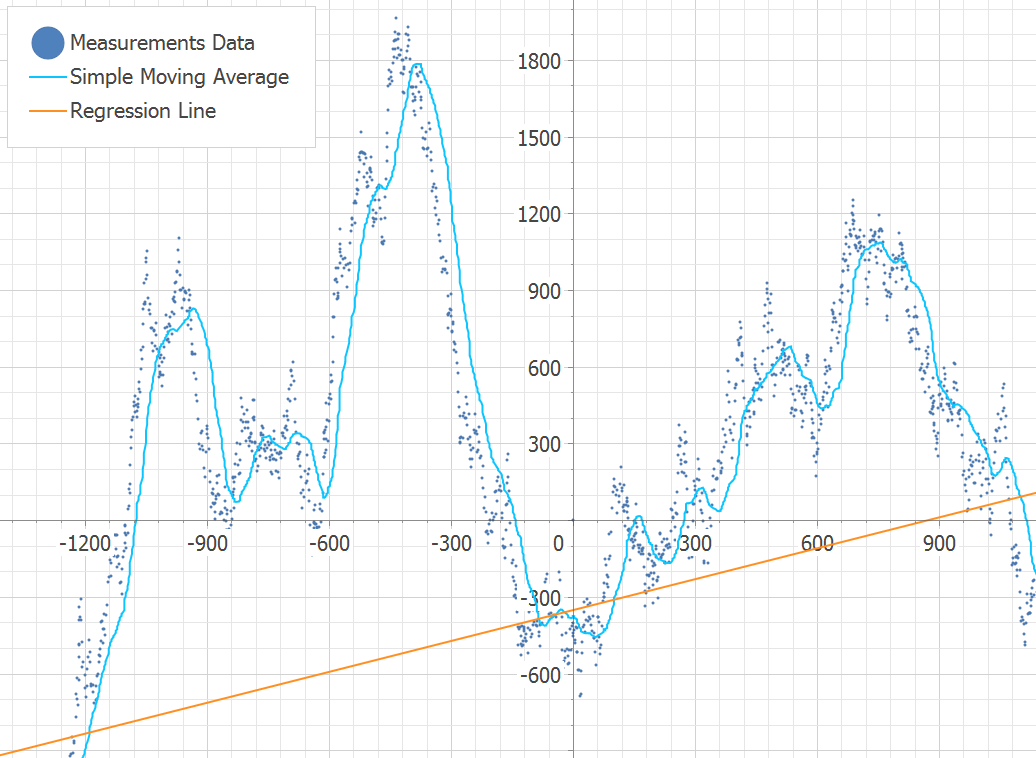
We expect to use our calculation engine to generate pre-configured trend lines for a variety of analytics scenarios. Though you can use Window Calculations for this purpose, we believe our implementation (trend lines) will be easier to use and more configurable.
Features Under Consideration
Support Pivot Grid Master Filtering
As you may know, our current release does not allow you to use the Pivot Grid Item as a Master filter (though workarounds exist). This feature will extend our Master-Filter engine and allow you use the Pivot Grid as a Master-Filter.
A Web-based Data Federation Wizard
While you can create a Federation Data Source in code (both desktop and web), end-users only have access to a WinForms Federation Wizard (part of our WinForms Dashboard Designer). Our web-based Federation Data Source End-User Wizard will replicate the functionality found in its desktop counterpart.
Web Dashboard – Material Theme Support
Improved Real-Time Dashboard Update Support
Improved Right-To-Left Support
Your Vote Counts
As we mentioned earlier, your vote will help us refine our 2020 Roadmap. Please take a couple of minutes to answer the following questions.