In this post, we’ll outline some of the features we expect to ship in our next major release (v20.1). If you are active Universal or DXperience Subscribers, you are entitled to download our Early Access Preview (v20.1). If you are using DevExpress Charts, please take a moment to review this post and help us refine our implementation prior to the end of our current development cycle.
Early Access and CTP builds are provided solely for early testing purposes and are not ready for production use. This build can be installed side by side with other major versions of DevExpress products. Please backup your project and other important data before installing Early Access and CTP builds.
This EAP may not include all features/products we expect to ship in our v20.1 release cycle. As its name implies, the EAP offers an early preview of what we expect to ship in two months.
This post does not cover our JavaScript charting library. We’ll publish information on JavaScript related enhancements in a separate post.
WPF Charts - Customization Toolbar
The WPF Chart Toolbar allows you to quickly customize chart elements. End-users can print a chart, invoke the Chart Designer, change on-screen data range and much more. Toolbar content is customizable - you can add your own items (commands) and hide items you consider unnecessary.

Demo: MVVM Financial Charting
Documentation: Chart Ribbon and Toolbars
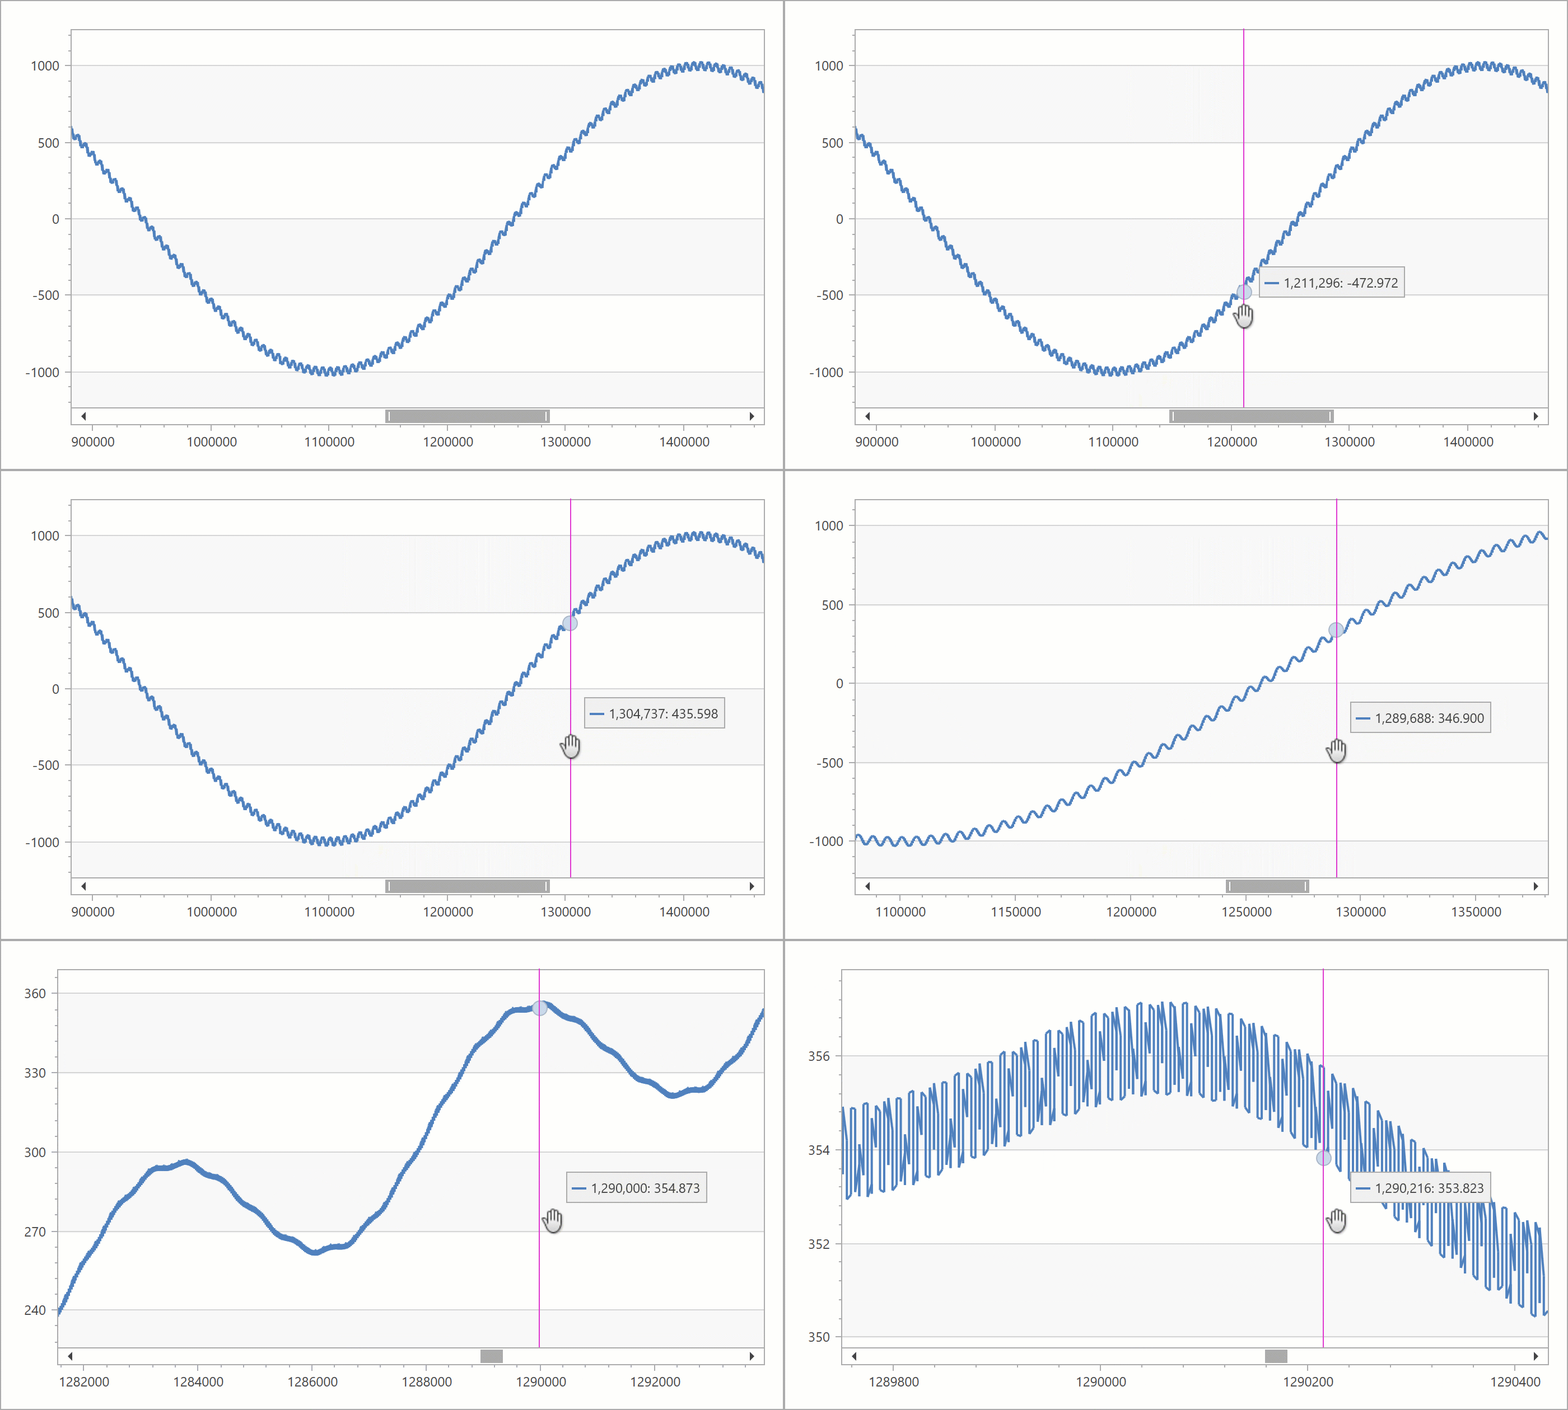
WPF Charts - Large Data Source Processing
v20.1 introduces a new data processing option to minimize memory footprint when processing extremely large datasets. This new mode is automatically enabled for charts with sorted numeric arguments and numeric values. You can also manually activate this mode using the XYSeries2D.AllowResample property.

Supported series types (EAP v20.1):
- LineSeries2D
- SplineSeries2D
- SplineAreaSeries2D
- SplineAreaStackedSeries2D
- AreaSeries2D
- AreaStepSeries2D
- AreaStepStackedSeries2D
- AreaStackedSeries2D
- BarStackedSeries2D
Demo: Large Data Source
Charts - New DateTime Axis Mode (WinForms, WPF, ASP.NET)
We enhanced the Date-Time scale by adding a SkipRangesWithoutPoints option. Enable it to automatically exclude all axis ranges without data points. This feature is especially useful for financial charting - you no longer need to manually define non-working date intervals.

Demo: Financial Charting
Charts - In-place Edit Mode for Annotations (WinForms, WPF)
You can now use the Chart Toolbar to add and remove annotations at runtime.
You can also enable the RuntimeEditing option for your existing annotations (allow end-users to edit text and replace images).

Demo: Annotations (WinForms) | Annotations (WPF)
Charts - New Series Label Display Mode (WinForms, WPF, ASP.NET)
Prior to v20.1, our Chart Control used the Series.LabelsVisibility property value to display or hide all Series labels simultaneously. We’ve added a new SeriesBase.LabelVisibilityMode setting so you can choose between various Series label display modes:
- First - Displays the first Series label based on the current X-Axis range.
- Last - Displays the last Series label based on the current X-Axis range.
- FirstAndLast - Both first and last Series labels are displayed based on the current X-Axis range.
- All - All series labels are visible (similar to LabelsVisibility = True)
- None - All series labels are hidden (similar to LabelsVisibility = False)

Note: LabelsVisibility property will continue to work (backward compatibility).
Demo: Large Series Number (WinForms) | Large Series Number (WPF)
WinForms Maps - Vector Item Enhancements
v20.1 includes a number of vector element enhancements:

Demo: Map Elements
Maps - New Vector File Format Support (WinForms, WPF)
The DevExpress Map Control supports data visualization for the following file formats:
Charts - Demo Enhancements (WinForms, WPF)
We have created new demos to cover two popular usage scenarios:


Free DevExpress Products - Get Your Copy Today
The following free DevExpress product offers remain available. Should you have any questions about the free offers below, please submit a ticket via the
DevExpress Support Center at your convenience. We'll be happy to follow-up.