Charts (WinForms, WPF, ASP.NET, MVC, .NET Core) – API enhancements (v20.1)

Calculated Fields
Our .NET Chart Control (across all supported platforms including WinForms, WPF, ASP.NET, MVC and .NET Core) now supports a new data processing option that allows end-users to define new data fields using Criteria Language Syntax.
This feature is especially useful when you enable our runtime Chart Designer in your application. If an end-user needs to visualize extra parameters based on an existing model, you do not need to change data model definition and redeploy your application. A calculated field will be automatically evaluated at runtime, and can be used like any other data source field at runtime. Of course, you can also create charts with predefined calculated fields within the Visual Studio IDE.
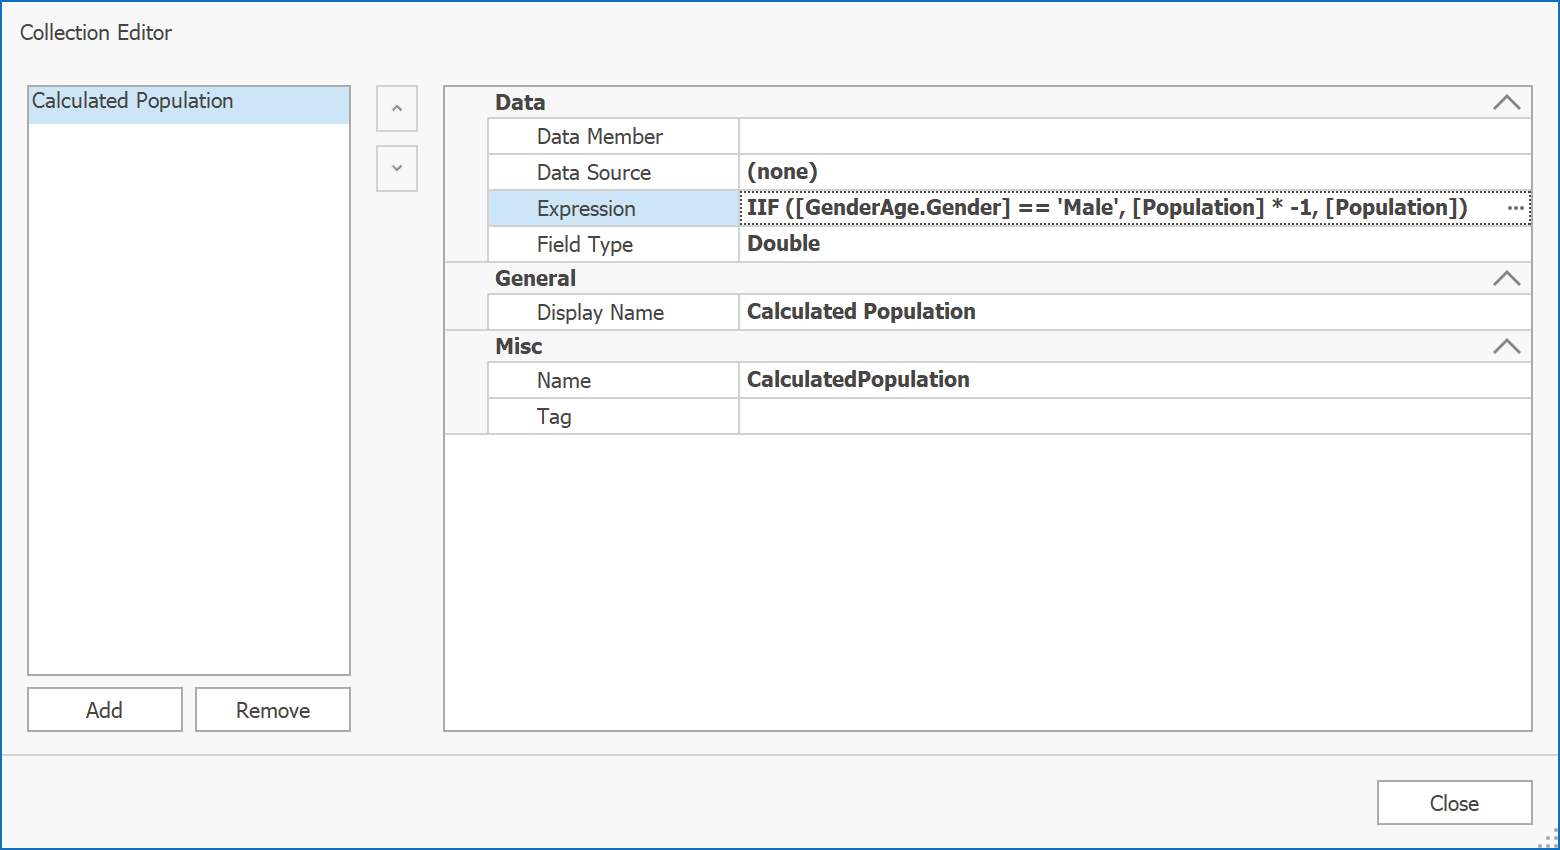
A quick example. We used a calculated field in our new Tornado Chart demo module to apply a negative sign to the Series point value. Note the expression definition below:
IIF ([GenderAge.Gender] == 'Male', [Population] * -1, [Population])
The result is that “Male” Stacked Bar Series points are displayed on the left, while Series labels still show original “Population” field values.

You can add calculated fields by entering the required expression manually or using our standard Expression Editor dialog.

For additional information, please refer to the following help topics: Calculated Fields (WinForms), Calculated Fields (ASP.NET), Calculated Fields (WPF).
If you’ve already installed our latest version (v20.1) on your machine, you can also try our corresponding demo modules: Tornado Chart (WinForms), Tornado Chart (WPF).
New Axis Side Margin
Another useful feature is related to axis side margins. As you may know, our Chart control already supports a Range.SideMarginsValue property. This property increases the space between outermost Series points and the diagram's edge by a specified margin value.
Based on the support traffic we found that in certain scenarios, developers need to specify side margin values separately. To address this requirement we enhanced v20.1’s Range class API with two new properties: StartSideMargin and EndSideMargin. Note that you can still use the Range.SideMarginsValue property to define start/end margins simultaneously.
You can also specify margins as a percentage of the axis range by setting the Range.SideMarginSizeUnit property to AxisRangePercentage. In this instance, actual margin size will be calculated relative to current axis range intervals. This will help those who need to allocate extra space in the chart’s diagram for display text or image annotations (see the screenshot below).

If Range.SideMarginSizeUnit is set to AxisUnit, our Chart control uses the current axis measurement unit when calculating actual margin size.
For additional information, please refer to the following help topics: StartSideMargin, EndSideMargin (WinForms), StartSideMargin, EndSideMargin (WPF).
Feedback
As always, we welcome your thoughts. Please comment below and let us know what you think of these new features.
Free DevExpress Products - Get Your Copy Today
 The DevExpress Team