Last week I sat down with the XtraCharts developers in order to have a discussion about why they're so jazzed about the new chart enhancements in DXperience v2007 vol 2. All I can say is they certainly have a reason to be excited; sitting down with them has infected me with their enthusiasm as well. This latest version has so upped the ante versus other chart products that it's going to be hard to catch up.
What I'll do is talk about the enhancements in three or maybe four blog posts. In this one, I'll talk about scrolling and zooming in the 3D charts.
To be honest I thought this was going to be a gimmick. Who the heck would need 3D charts that respond to user interaction? A chart is a chart is an image. OK, zooming I can make a case for, but scrolling? Well, having tried it out, just count me converted. Interactive graphs are the way forward, a boon to your users, and XtraCharts makes implementing this functionality painless in your WinForms applications.
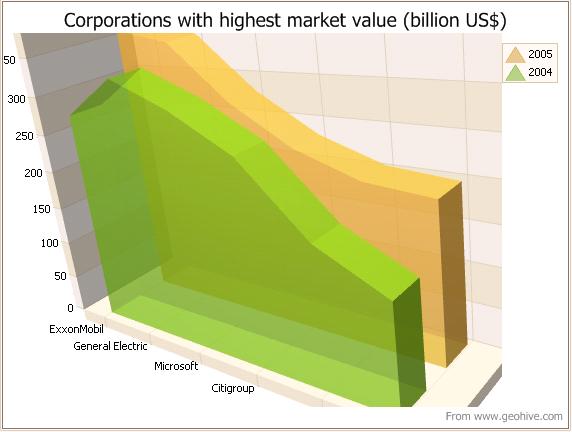
First of all there's the zoom feature. If you have a complex graph to view, being able to zoom in on the detail is priceless. Perhaps you're not bothered about the part of the chart over there, but are really interested in this part here. Using the mouse wheel you can zoom in and out remarkably easily. First the original chart:

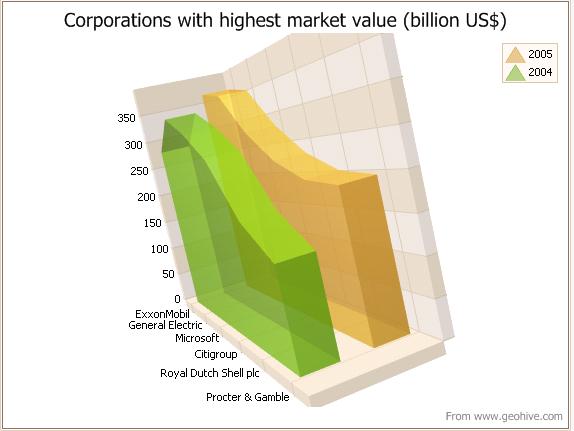
Now the chart zoomed:
(Note: it's amazing how intuitive this was for me. No one told me this was how it worked, but nevertheless I naturally used the mouse wheel to do the zooming. I certainly didn't right-click and look for a Zoom option in the context menu, for example.)
Second, there's the scrolling feature. Now, agreed, in XtraCharts we now have transparency for our 3D charts. Suppose we have one of the new 3D Area charts: we can define the transparency value for the series so that we can "see through" the nearest chart to those further away.
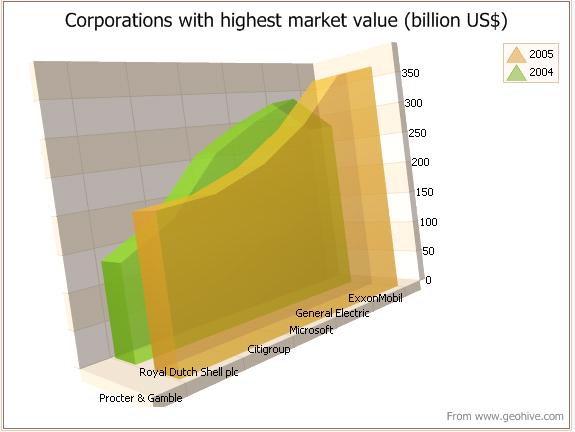
This of course helps us understand the series that are partially obscured. Nevertheless, I find myself wanting to turn the chart around a little bit so that I can see those obscured parts of the data series that are behind. Well, now you can: in a WinForms application, the mouse cursor changes into an open hand when you hover over the chart: simply "grab" part of the chart (the cursor changes to a closed fist) and move the mouse to cause the chart to rotate and scroll. After a bit of practice, you can rotate the chart to show exactly the right view.
And what's even more is that XtraCharts doesn't just treat the chart as a 3D object: it makes sure that, no matter how you rotate the chart, the planes showing the axes are always "behind" the chart; they never obscure the actual data.
Now, I'll admit that this interactive zooming and scrolling of 3D charts only works with WinForms applications, and it certainly takes some processing power to generate a fluid and responsive display. (I run a Core 2 Duo, and when I rotate and zoom, the CPU speed shifts into high gear and the CPU usage revs into the red.)
For ASP.NET, XtraCharts generates an image of the chart on the server and then sends that to the browser. The chart is static. Although you could do some work to make charts interactive in the browser, the immediate feedback won't be there since, for every angle or zoom level, XtraCharts has to generate another image to send. But we're looking into what we can do for this type of functionality in a future version.
So, all in all, a nice big thumbs up for 3D zooming and scrolling. It puts some real power in the hands of your users at virtually no cost to you, the developer.
Next time I'll talk a bit about Gantt charts and of the improvements there.
Free DevExpress Products - Get Your Copy Today
The following free DevExpress product offers remain available. Should you have any questions about the free offers below, please submit a ticket via the
DevExpress Support Center at your convenience. We'll be happy to follow-up.