In
one
of the screencasts I narrated recently, I talked about how using
the data crunching capabilities of a server versus those of the client
can paradoxically make the user experience of using a grid control
with large datasets more pleasant.
I say "paradoxically" because it would seem that having the data on
the client locally would result in a better experience, rather than
having to scurry back and forth to the server fetching more and more
data. In reality what happens is the initial download of all the data
is the big time sink and problem (and then having to repeatedly do the
same as you analyze the data). Replacing that huge engulfing of data
with piecemeal sipping turns out to be more pleasant
from the user's perspective: the delays the user experiences during
data analysis are smeared out across all interactions and not clumped
into some.
There's another place in our component suites where we make use of
server processing to alleviate the clumpiness of this downloading of
data, and that's with our
XtraPivotGrid.
The XtraPivotGrid is a specialized grid that helps the user organize
and analyze statistical, business, and financial data though its
ability to summarize and present large amounts of information in a
cross-tabular form. For example, the user can analyze revenue data
during set periods (months, quarters, etc) by customer or product
group, and so on.
By default the way the pivot grid works is to do the initial big
swallowing of all the data. And because, in general, the pivot grid is
going to be used on a lot of data (it's after all going to be used to
analyze, summarize, organize data, so it needs it all), that's going
to take some time, even if your database is local. A huge amount of
memory is going to be allocated on the client to hold and process this
data.
So a strategy for reducing these performance and memory issues at the
client is to get the data server to do some of the work. After all, a
good server would be able to share the results of queries amongst
several clients. For an analysis tool like the pivot grid, the type of
server that would be best at this work would be an OLAP server (Online
Analytical Processing server).
An OLAP server serves up what are known as data cubes. Instead of a
simple relational model as in the standard relational databases, an
OLAP server uses a mix of hierarchical and navigational models in
order to store and serve data in a multidimensional matrix. Terms used
with OLAP servers are 'dimensions', which are the rows and columns of
the matrix, and 'measures', which are the values or fields in the
matrix. OLAP servers are optimized for financial type data and the
principal dimensions used are time, locations, people, products and so
on.
Back to the pivot grid. Ignoring the adornments of the grid itself
— for example the borders, the column and row headers — in
essence the pivot grid displays a matrix of similar data, exactly the
output from an OLAP server. The XtraPivotGrid has a mode wherein it
will construct and execute queries on a cube served up by the OLAP
server. In this mode, it is the OLAP server that will aggregate data,
sort it, group it, calculate summaries and so on, and then return the
results to the pivot grid.
To use a cube on an OLAP server, there are a couple of steps you need
to make:
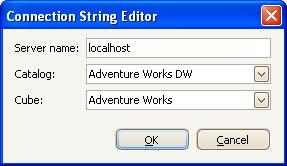
1. Specify the connection settings for the server as a connection
string using the PivotGridControl.OLAPConnectionString property. This
connection string defines the names of the server, the data catalog,
and the cube to use. At design time, you can build the connection
string via the Connection String Editor available with the
OLAPConnectionString property in the Properties grid.
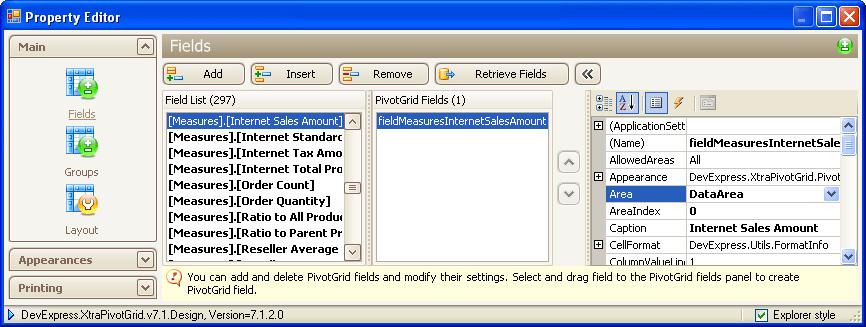
2. Create fields in the XtraPivotGrid control that represent the
specific measures and dimensions of the cube you wish to use. At
design time, it's easy: after the connection string has been
specified, you can open the Fields page of the pivot grid's designer
and the Field List pane will contain all the available measures and
dimensions of the cube. You can then add a specific measure or
dimension to the XtraPivotGrid control by dragging it onto the Fields
pane.
Of course, should you need to, you can do all this in code as well.
See the help file for details.
After these properties have been set, the pivot grid will query and
fetch the required data from the OLAP server. As discussed before,
only the data needed for display in the grid is fetched, with the
server doing the aggregation, sorting, and summarizing of the data.
At present we support
Microsoft
SQL Server Analysis Services (SSAS), both the 2000 and 2005
versions. The client requires the Analysis Services OLE DB provider to
be installed as well (the latest release can be downloaded from the
Microsoft web site — search for "Feature Pack for SQL Server").
So if you have a lot of financial or business data you want to crunch
and you want to enable your users to analyze this information —
after all, raw data becomes actionable information through analysis
— you should be thinking about an OLAP server and then use
XtraPivotGrid in the hands of your users.
Free DevExpress Products - Get Your Copy Today
The following free DevExpress product offers remain available. Should you have any questions about the free offers below, please submit a ticket via the
DevExpress Support Center at your convenience. We'll be happy to follow-up.