DXperience v2008 vol 3: Fibonacci indicators in financial charts
A new feature in our charting product, XtraCharts, for both the WinForms and ASP.NET platforms, are Fibonacci indicators for financial charts. Since these are not well-known outside financial circles, let me quickly introduce what they are.
Fibonacci Numbers
I'm sure you've heard of Fibonacci numbers; after all, they're a classic example when introducing recursion. A Fibonacci sequence is a sequence where a given number is equal to the sum of the previous two entries in the sequence, with the proviso that the first two are both 1. So we get as the canonical sequence: 1, 1, 2, 3, 5, 8, 13, 21, 34, 55, 89, and so on.
Although many people are aware of this sequence, not many know that the ratio of one number to the next converges to approximately 1.618 as you go through the sequence. So 8/5 is 1.600 and 13/8 is 1.625 and 89/55 is 1.618. The limiting ratio is known as the golden ratio, is denoted in mathematics by the Greek letter phi (φ) and is equal to (1 + √5)/2. The reciprocal of the ratio is 0.618.
Support and Resistance
Although interesting, what's this got to do with finance? For that we have to understand the concepts of support and resistance. When a stock is rising, there will be a point when selling will start to dampen the rise and force the price down. This is resistance. The same happens when stock is falling: at some point buying will start to dampen the fall and start to force the price up. This is support. Both support and resistance are an example of market corrections.
The theory goes that if a new price level is found, either though resistance or support, the level will occur within certain bands demarcated by Fibonacci numbers, especially the golden ratio. The three main ways XtraCharts calculates these bands are retracements, fans, and arcs.
Fibonacci Retracements
Identify a low and a high in the stock price. Call one extreme 0% and the other 100%. The theory goes that if support or resistance are in play, you should be able to see it in the band from 38.2% to 61.8% (the latter ratio is our old friend φ minus 1, and the other ratio is 1 minus that value; if you like, the ratios of one Fibonacci number divided by the next, or divided by the second next).

Essentially we draw horizontal lines for 0% and 100% and then draw horizontal lines for 38.2%, 50%, and 61.8%. If there is support or resistance, we should see the evidence in that middle band as the price moves there.
Fibonacci Fans
Identify a low and a high in the stock price. Call one extreme 0% and the other 100%. Draw a vertical line from the second extremity to the level of the first, mark the usual three ratios on that line. Now draw lines from the first extremity to the three ratio marks.
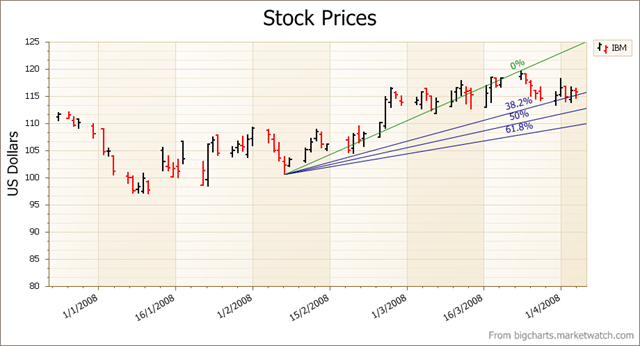
The theory here is to look at whether the price moves up or down quickly or slowly through this middle fan of lines and use this to analyze whether there is support or resistance to the stock price.
Fibonacci Arcs
Identify a low and a high in the stock price. Call one extreme 0% and the other 100%. Draw a trend line from one to the other. Mark off the usual ratios on this line and then draw arcs from the second extremity that intersect these ratio marks.
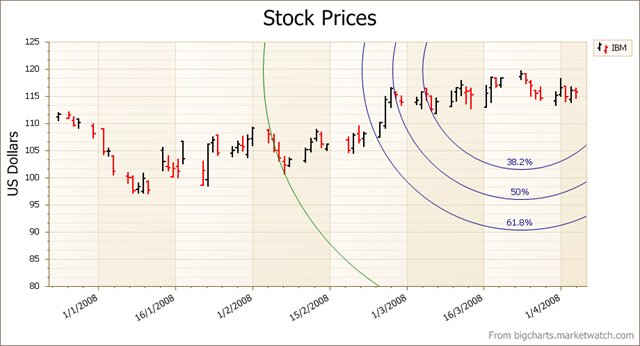
The theory here is to look for evidence of support (rising prices) or resistance (falling prices) through the middle Fibonacci band.
(By the way, you can also use other Fibonacci ratios, 23.6% and 73.4%, to widen the bands.)
Free DevExpress Products - Get Your Copy Today
 Julian Bucknall (DevExpress)