The Charts team hit code freeze this week, ready for v2009.3, so we now know for certain what is going to be in the release. Consequently, feast your eyes on these new features for DXCharts for WPF.
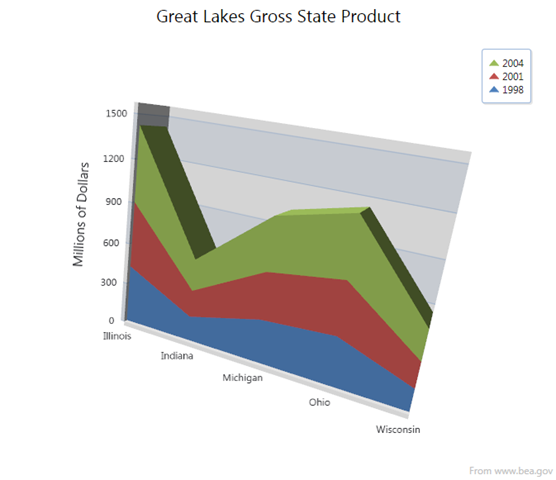
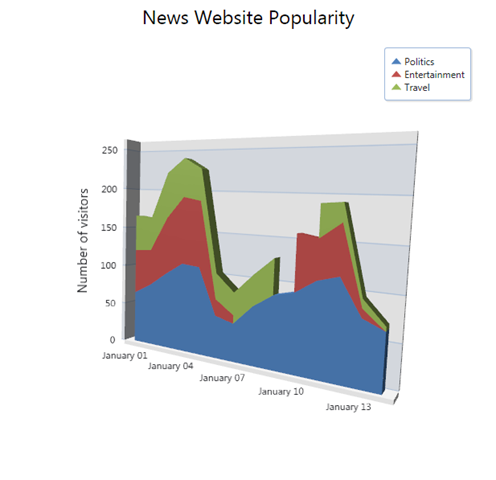
Firstly, we have titles for the axes in both 2D and 3D charts. Here's a 3D stacked area chart showing such a title on the y-axis, the values axis.
Next up, we've added custom draw capabilities. To see this, here's an unadorned bar chart:
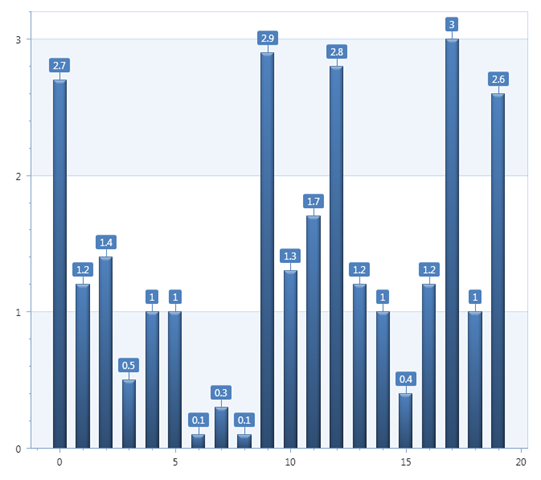
Now we'll color the bars according as to whether the bar height is less than 1.0, between 1.0 and 2.0, or greater than 2.0:
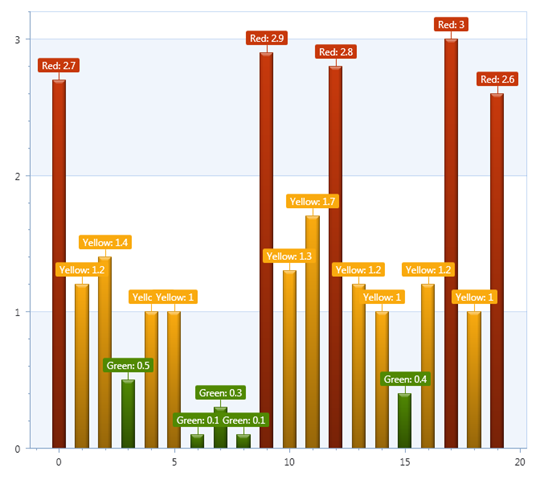
Note we're also changing the bar label as well.
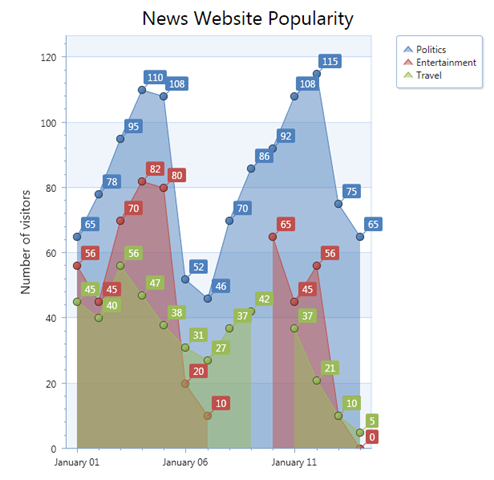
The third feature is support for empty points within a series (that is, data points with no values). Here's an area chart in 2D, with both the "Entertainment" and "Travel" series missing some data points:
And here's a 3D area chart showing similar data:
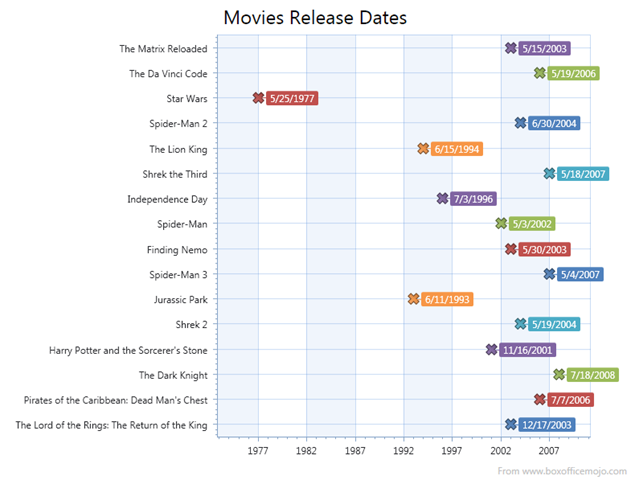
Fourth, we've added a Date/Time scale for the y-axis, the values axis. This example has the values axis displayed horizontally:
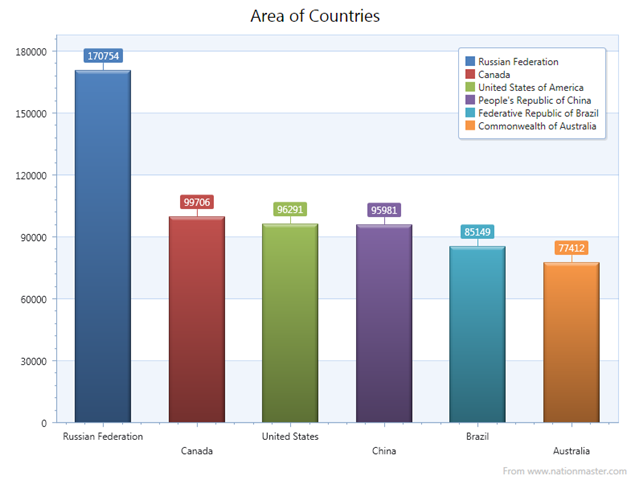
 Finally, we've added the series point Tag property. This works in a similar way to the same feature in XtraCharts: you write a handler for the CustomDrawSeriesPoint event and the eventargs has the SeriesPoint object, whose Tag property you can now set. Here's an example, showing the legend being more informative than the x-axis labels.
Stay tuned for more sneak peeks over the coming days and weeks.

Free DevExpress Products - Get Your Copy Today
The following free DevExpress product offers remain available. Should you have any questions about the free offers below, please submit a ticket via the
DevExpress Support Center at your convenience. We'll be happy to follow-up.