DevExtreme React Chart - Color Palettes and Pie Chart Legends (v1.8.0)

Version 1.8.0 of the DevExtreme Reactive controls is now available! These are the new features in the React Chart:
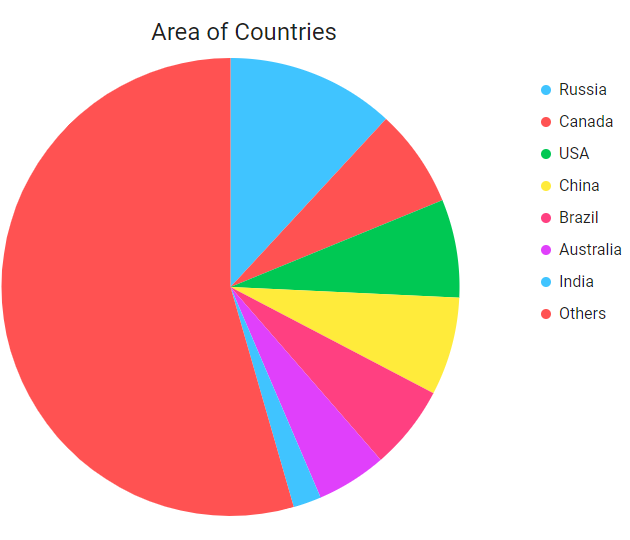
Legends in Pie Charts
For most chart types, the legend displays one item for each series in the chart. Pie charts frequently have just one series and users expect the legend to display an item per data point. The Legend plugin now detects the situation automatically where a single pie series is shown in a chart, and switches to per-point items.
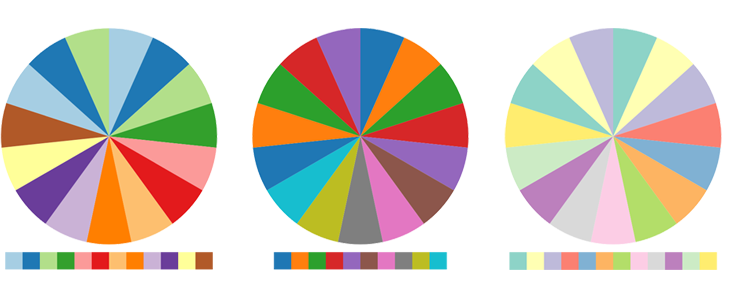
Custom color schemes
The Palette plugin makes it easy to set up custom colors for a chart.
Please let us know your thoughts
As always, we appreciate any comments left on this post or sent to us via the Support Center or the GitHub Repository. To provide quick feedback, please submit your replies to this small survey:
Free DevExpress Products - Get Your Copy Today
The following free DevExpress product offers remain available. Should you have any questions about the free offers below, please submit a ticket via the DevExpress Support Center at your convenience. We'll be happy to follow-up.
 Oliver Sturm (DevExpress)
Recent Posts
Svetlana Troitskaya (DevExpress)
Elena Dikareva (DevExpress)
Vlada Skorokhodova (DevExpress)
Vlada Skorokhodova (DevExpress)
Vlada Skorokhodova (DevExpress)