DevExtreme - Charts - Annotations (v19.1)

DevExtreme Charts just got even more powerful: We added support for chart annotations in our v19.1 release. Using the new features, you can display text or image annotations on the chart surface, and anchor them to various different types of locations.
The new functionality described in this post is available on all platforms supported by DevExtreme, including Angular, Vue, React, jQuery and ASP.NET MVC and ASP.NET Core.
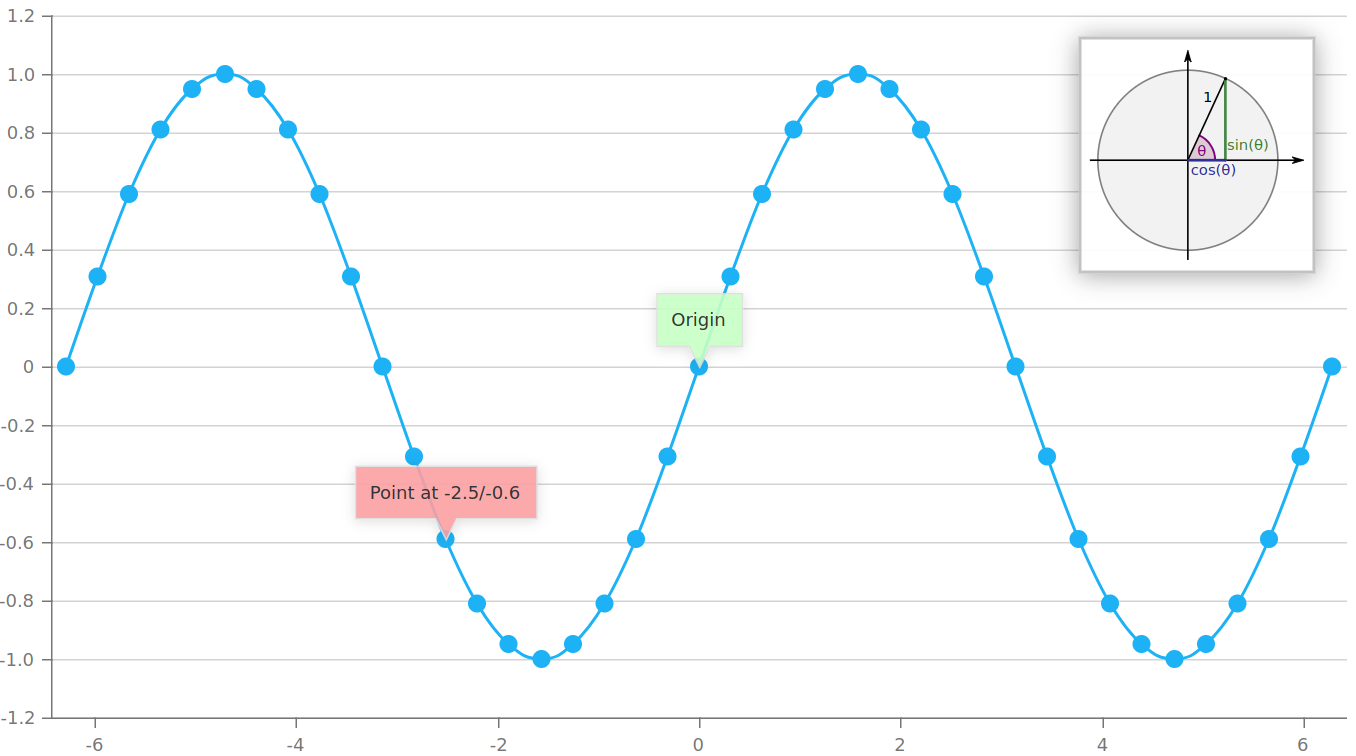
There are two types of annotations: image and text. You can see both in the image above. Annotations can be styled using a range of visual parameters. The most important concept, however, is that of anchoring: annotations are positioned on the chart surface, often in relation to other chart elements.
The Origin annotation in the image is defined using this code:
{
  type: 'text',
  text: 'Origin',
  series: 'sine'
  argument: 0,
  color: '#c7ffc4',
}
For anchoring purposes, the parameters series and argument are the important ones. The argument relates to the argument value of the chart datasource (i.e. the horizontal axis). Without a series parameter, the annotation would point at the axis value itself, but since the series name is given in the example, the annotation is placed near the series point for the given argument.
The red annotation in the example uses these parameters:
{
  ...
  value: -0.5877852522924732,
  argument: -2.5132741228718345,
  ...
}
These are values taken from the chart datasource, so the annotation points precisely at the related series point. However, you can place an annotation anywhere you want using argument and value pairs – they are interpreted as coordinates related to the value ranges of the chart.
Finally, here’s the code for the illustrative image (courtesy of Stephan Kulla and Wikipedia) in the top-right corner of the chart:
{
  type: 'image',
  image: {
    url: '...',
    width: 150,
    height: 150
  },
  x: 800,
  y: 100,
  border: {
    color: '#bbbbbb',
    width: 2
  },
  shadow: {
    blur: 8,
    opacity: 0.4
  },
  paddingLeftRight: 3,
  paddingTopBottom: 3
}
Positioning is absolute in this case, using the x and y parameters. The additional options illustrate some of the visual styling features supported by chart annotations.
At least one cool feature is not shown in the image above: Tooltip support
Try It Now
If you’d like to test this feature, you can do so right now using the public beta version. Use the npm pre-release package:
npm install --save devextreme@19.1-next
Documentation is available here: annotations, commonAnnotationSettings, customizeAnnotation
Future Plans
For v19.2 we are working on a custom annotation type using templates, as well as dragging support for annotations.
What Do You Think?
We would love to hear from you. If you have any questions or suggestions, please consider posting them to this github issue for discussion. Of course you can also comment below or open Support Center tickets.
Join The Webinar
If you’d like to see all the new features introduced in v19.1, please sign up for our upcoming webinar using this link: Sign Up For DevExtreme v19.1 Webinar
Free DevExpress Products - Get Your Copy Today
 Oliver Sturm (DevExpress)