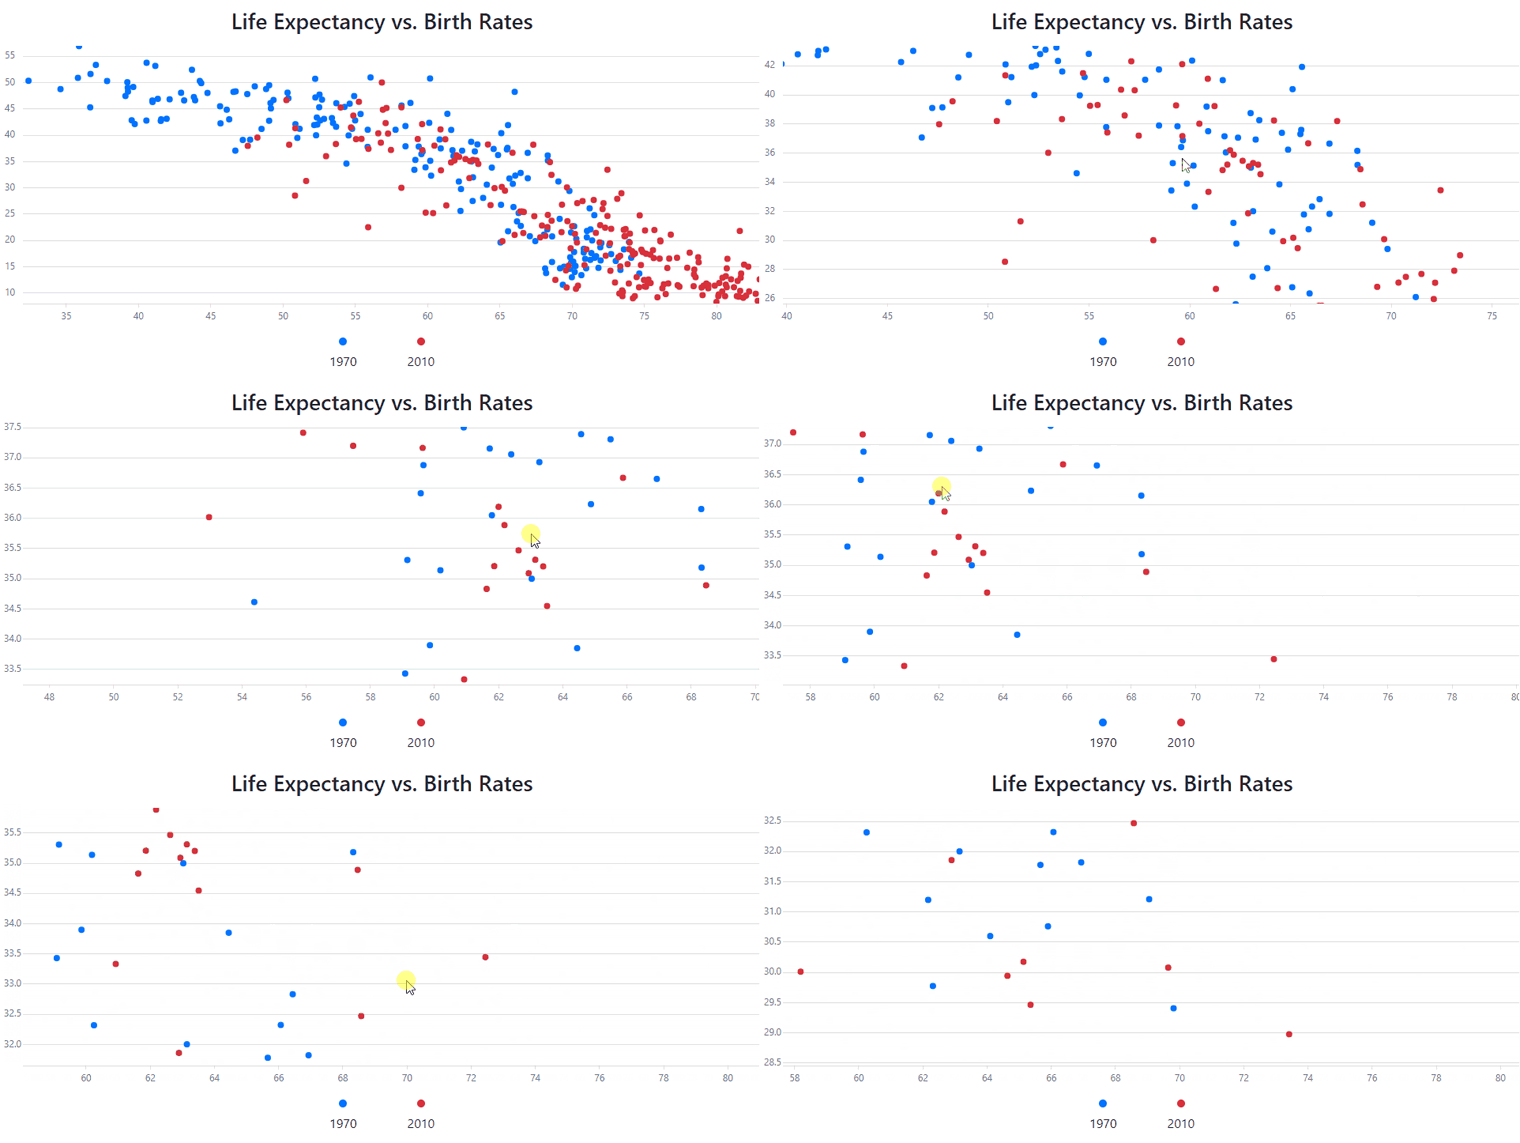
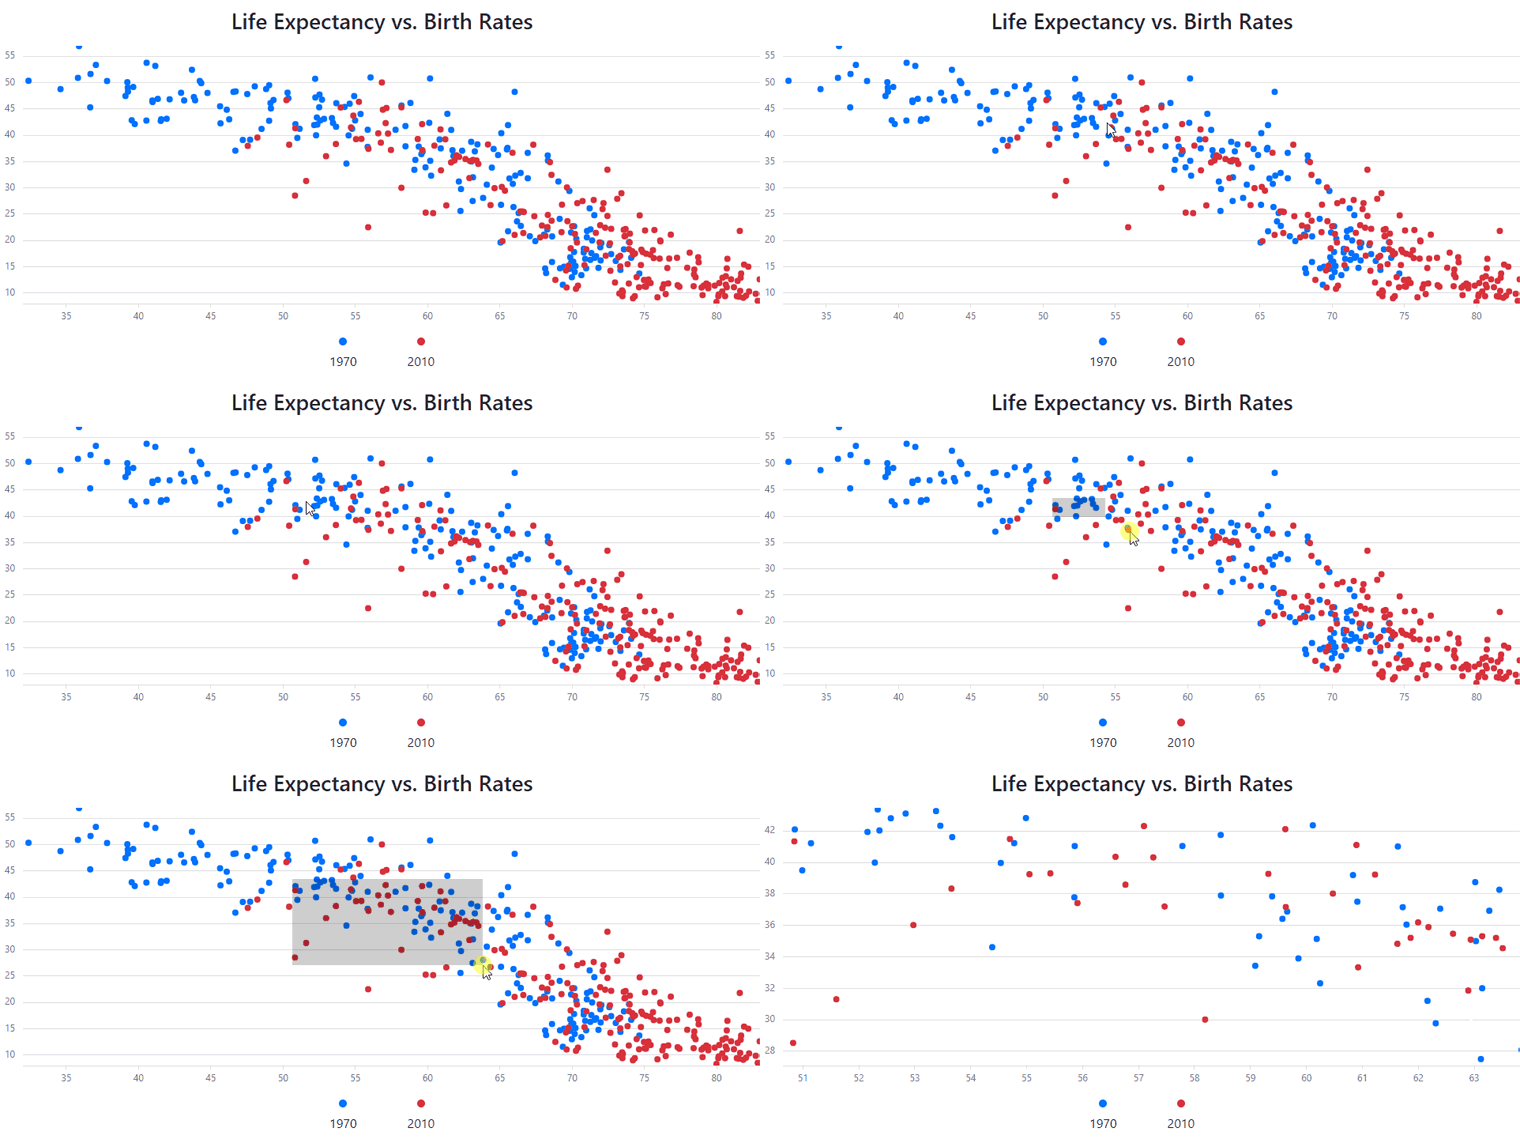
Our React Chart is getting better all the time! In v19.1 we added interactive features that allow users to zoom and pan the chart content with the mouse or with touch gestures.

To activate the new functionality, simply add the ZoomAndPan plugin to the component. You can also use the plugin in controlled mode by setting its viewport and onViewportChange properties.
To control the dimensions for the zoom and pan operations, there are two properties interactionWithArguments and interactionWithValues. Each of these can be set to zoom, pan, both or none. This gives you precise control of the interactions available to the end user.
To pan the chart, the user simply drags the mouse or their finger. To zoom, they can use pinch gestures or the mouse wheel. Additionally, region selection is supported by mouse. By default, the shift key enables this, but the modifier can be changed using the zoomRegionKey property.

There is a guide article available in our documentation, which includes some demos. Here’s the reference for the ZoomAndPan plugin, and the demo you saw in the animations above is available here.
What Do You Think?
Please don’t hesitate to leave a comment below if you have any thoughts on the new functionality. You can also access the GitHub repository and submit issues there.
Free DevExpress Products - Get Your Copy Today
The following free DevExpress product offers remain available. Should you have any questions about the free offers below, please submit a ticket via the
DevExpress Support Center at your convenience. We'll be happy to follow-up.