Early last year, we introduced annotation support to DevExtreme Charts. With our v20.1 release, we’ve extended annotation support to our Polar Chart. You can now apply text, image, or custom annotations as needed. Once you create an annotation, you can attach it to a Polar Chart element (such as a series point) or display it at specific coordinates.
To display annotations in our Polar Chart, use the new `annotations` option (accepts an array of configuration objects that represent individual annotations). Each object includes a `type` property. Supported annotation types include ‘image’, ‘text’ and ‘custom’. Based upon the desired annotation type, your configuration object must specify `image`, `text` or `template`.
The example below lists all supported annotation types:
<dx-polar-chart>
    …
    <dxi-annotation
        image="https://sun.png "
        type="image"
        argument="July"
        series="Day">
    </dxi-annotation>
    <dxi-annotation
        text="Custom text"
        type="text"
        [radius]="100"
        [angle]="45">
    </dxi-annotation>
    <dxi-annotation
        template="template"
        type="custom"
        argument="October"
        [value]="17">
    </dxi-annotation>
    <svg *dxTemplate="let annotation of 'template'">
        <image attr.href="https://cloud.png" width="60" height="40" />
        <text x="8" y="60" >and text</text>
    </svg>
</dx-polar-chart>
The configuration above generates the following visualization:

Annotation Position
You can attach an annotation to a Polar Chart UI element, or leave it unanchored at absolute coordinates. Let’s review position-related options available to you:
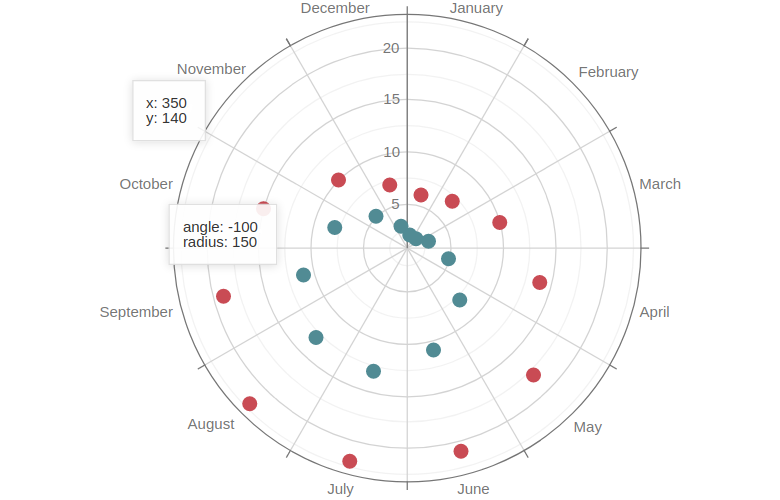
Unanchored Annotations
In the following example, annotations are not connected to any Polar Chart UI element. They use absolute coordinates.
annotations: [{
    x: 350,
    y: 140
}, {
    angle: -100,
    radius: 150
}]
Annotation Anchored to an Argument
annotations: [{
    argument: "February",
    value: 7
}]

Annotation Anchored to a Series Point
annotations: [{
    argument: "March",
    series: "Series 1"
}]

Annotation Anchored to an Axis
annotations: [{
    argument: "May"
}, {
    value: 15
}]

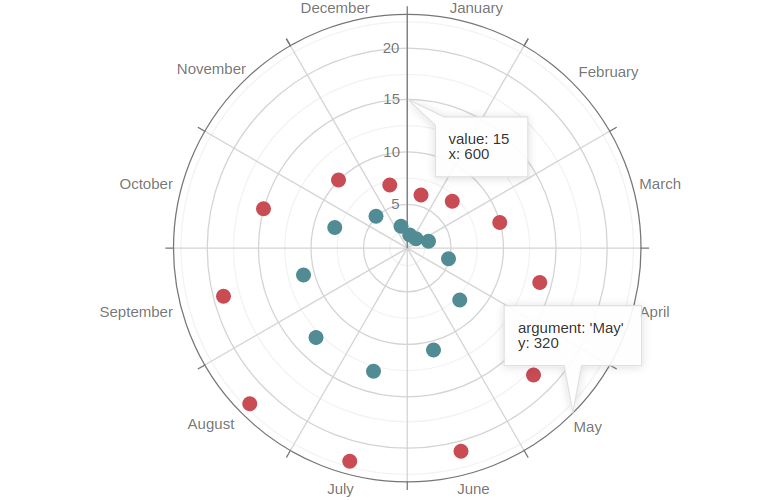
Annotations with Mixed Anchoring
In this example pixel and chart coordinates are used simultaneously:
annotations: [{
    argument: "May",
    y: 320
}, {
    value: 15,
    x: 600
}]
Common Annotation Settings
To specify common options for all annotations, use the ‘commonAnnotationsSettings‘ option. The following code sample applies background and font color for all annotations on the Polar Chart (Angular markup is used):
<dx-common-annotation-settings color="#5258c7">
    <dxo-font color="#ffffff"></dxo-font>
</dx-common-annotation-settings>

Configuration Based on Individual Annotation Data Points
Our Polar Chart component allows you to customize individual annotations via the ‘customizeAnnotation‘ callback function. This can help those who wish to obtain an annotation array from a remote data service. In the example below, we specify a background color for the annotations that belong to the ‘ DayTemperature‘ series:
// app.component.html
<dx-polar-chart ...
    customizeAnnotation: "customizeAnnotation">
    <dxi-annotation ...
        series="DayTemperature"
        text="Custom text 1">
    </dxi-annotation>
    <dxi-annotation ...
        text="Custom text 2">
    </dxi-annotation>
    <dxi-annotation ...
        text="Custom text 3">
    </dxi-annotation>
    <dxi-annotation ...
        series="DayTemperature"
        text="Custom text 4">
    </dxi-annotation>
</dx-polar-chart>
// app.component.ts
//...
export class AppComponent {
    customizeAnnotation(item) {
        if (item.series === "DayTemperature") {
            item.color = "#5258c7";
            item.font = {
                color: "#ffffff"
            };
        }
        return item;
    }
}

To learn more about our new Polar Chart Annotations feature, please refer to the following documentation topics: annotations, commonAnnotationSettings, customizeAnnotation.
Feedback
As always, we welcome your feedback. Please comment below and let us know what you think. Alternatively, you can share your thoughts via the following discussion page: Polar Chart Annotations
Free DevExpress Products - Get Your Copy Today
The following free DevExpress product offers remain available. Should you have any questions about the free offers below, please submit a ticket via the
DevExpress Support Center at your convenience. We'll be happy to follow-up.