This post covers the DevExtreme Funnel Chart widget, which is available for jQuery, as an Angular component, ASP.NET MVC and ASP.NET Core MVC controls, and as a Knockout binding.
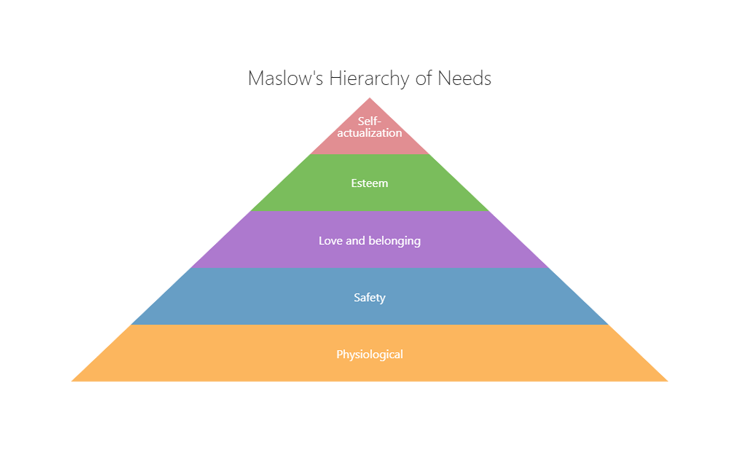
The Funnel Chart widget can be used to display pyramid charts as well as funnel charts (which have previously been described in this blog post). A pyramid chart is an isosceles triangle (meaning it has two sides of equal length) divided into sections. These sections are ordered by importance, which allows pyramid charts to be used to visualize hierarchies. The height of each section indicates quantity.
How to use a Pyramid Chart
Perhaps the most common example of a pyramid chart is Maslow’s hierarchy of needs. This pyramid arranges human needs from the most fundamental, such as food, water and rest, at the base to comparatively less essential, like fullfilling one’s potential, at the top. We created this chart using the new DevExtreme Funnel Chart widget available in the upcoming v17.2 release.
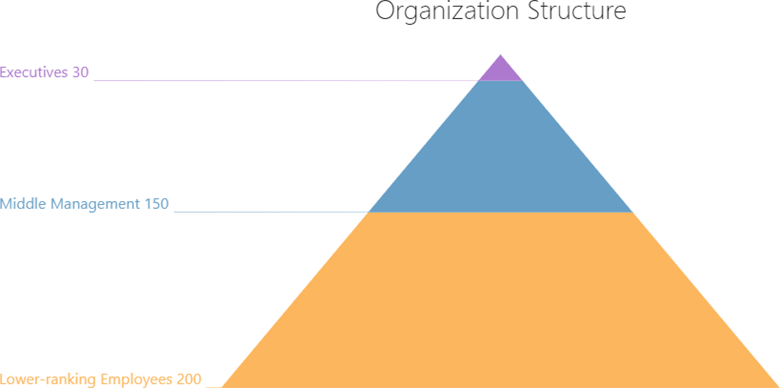
A pyramid chart has many applications besides Maslow’s hierarchy. Visualizing the organizational structure of a company is one of them. Executives appear at the top of the pyramid, above middle management, and lower-ranking employees are shown at the bottom. The chart reflects both the power structure in the company and the relative size of each group.
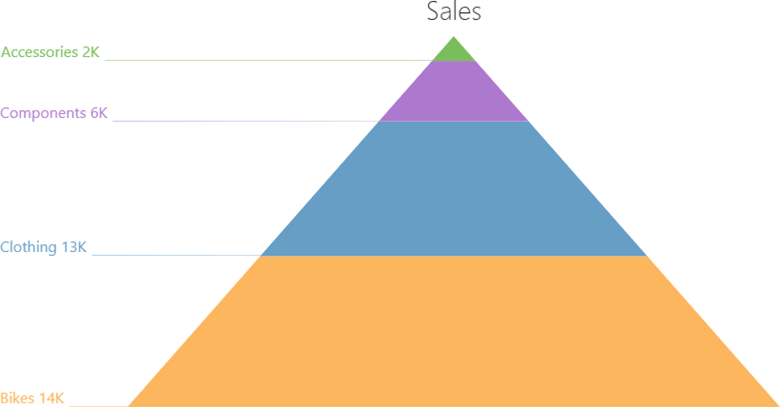
In the following example, a pyramid chart is used to analyze sales in a bike shop. In this case, the hierarchy indicates a priority of the goods sold by the shop, perhaps an advertising priority or a shipping priority. From this chart, you can see that clothing sells almost as well as bikes, which are presumably the “main” article, since they are shown at the pyramid base. Increasing the supply of clothing might add to the revenue.
Try it
A beta of v17.2 is available right now via npm:
npm i devextreme@17.2.2-pre-beta
Use the following code to create a simple pyramid chart:
$("#pyramid").dxFunnel({
  dataSource: [
    { item: "Lower-ranking Employees", count: 200 },
    { item: "Middle Management", count: 150 },
    { item: "Executives", count: 30 }
  ],
  title: "Organization Structure",
  sortData: false,
  argumentField: "item",
  valueField: "count",
  algorithm: "dynamicHeight",
  inverted: true
});
Please let us know your thoughts about this use case!
Free DevExpress Products - Get Your Copy Today
The following free DevExpress product offers remain available. Should you have any questions about the free offers below, please submit a ticket via the
DevExpress Support Center at your convenience. We'll be happy to follow-up.