Report Sparklines (coming in 13.1)

With the debut of our WinForms Sparkline control we’ve decided to also add it to our reporting toolbox.
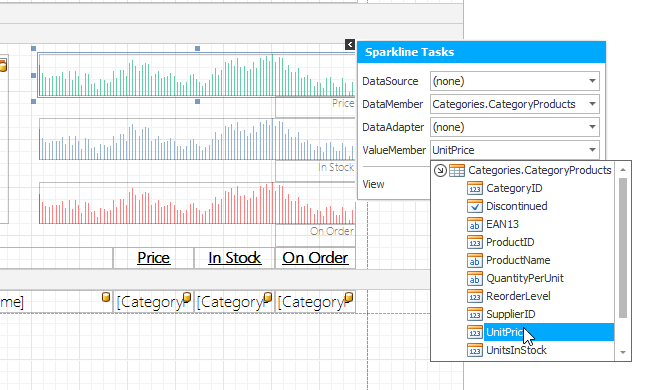
Reports Sparkline Design

Using Sparklines in reports is fairly straightforward. In this case I created the simple Category/Products report from the Northwind Database and added several Sparkline controls to the group header band of the Product detail section. From there it was a simple case of selecting the appropriate data member (which is already available from the report bindings) and value member. From there one can select the appropriate view and customize the colors as well as specific view properties.
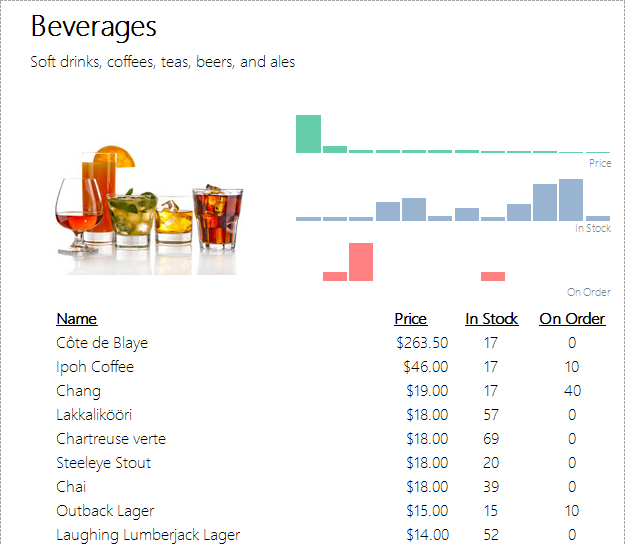
Reports Sparkline Preview

The end result is both elegant and informative! At a glance we cam compare product price, stock, and orders at a glance. For Beverages it becomes readily apparent that we have a stocking problem with one product and a pricing problem with another.

I am excited for the kinds of reports this type of control will enable and am looking forward to what you create!

As always, if there are any comments and/or questions, feel free to get a hold of me!

Seth Juarez
Email: sethj@devexpress.com
Twitter: @SethJuarez

Free DevExpress Products – Get Your Copy Today

The following free DevExpress product offers remain available. Should you have any questions about the free offers below, please submit a ticket via the DevExpress Support Center at your convenience. We’ll be happy to follow-up.
Peter Thorpe
Peter Thorpe

Excellent, I can see in your example report its at a group level to provide the data source. Will it be possible to use the control at report detail level by providing a custom datasource and filter similar to what you would for a chart control?

Using your example I am thinking each detail line would have an orders over time sparkline or similar showing a 12 month trend.

16 May 2013
Seth Juarez (DevExpress)

Peter:

  Great question. You can pretty much do whatever you like. In this case you could handle the Before_Print event on the Sparkline in order to populate the values in code. Let me know if this answers your question.

-Seth

16 May 2013
RMDC
PARDC

Seth - in profit and loss reporting it is common to see the current P&L column value, with something like YTD.  We were hoping that we could add a sparkline to our P&L by populating a string[] that contained the previous 12 months of activity for that account and then to have the sparkline illustrate the array.  The output row for the P&L might read Account,Current,YTD,Sparkdata and in the detail section of the report designer instead of hooking the control to multiple row values it would hook the sparkline to the array.  

I can't see a reasonable method whereby we can output the 12 prior months into row details and then output the sparkline as a details bound control.  Any suggestions?

18 October 2013

Please login or register to post comments.