HTML 5 Chart and Map Widget Enhancements (Now available in v14.2)
In our upcoming release, we’ve extended the capabilities of DevExtreme Complete with new HTML 5 data visualization widgets, new charts types, improved end-user experiences and dramatically improved performance.
New HTML 5 Polar Chart Widget
Polar Charts are a great way to display data whose values span cyclically repeating arguments. By using polar coordinates, you can display values related to each argument cycle as points - each displayed in a corresponding sector and having a radius proportional to the value itself. If you have multiple series, this widget allows end-users to compare values by viewing the resulting polygons.
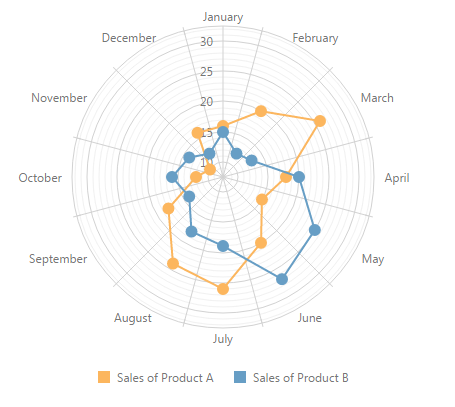
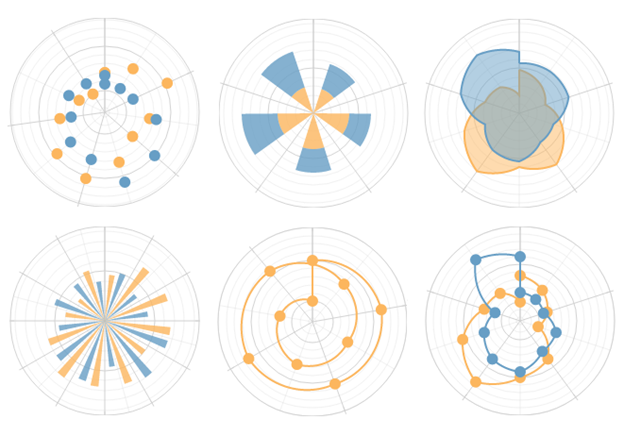
As you might expect, the DevExpress HTML 5 Polar Chart supports a variety of the series types - giving you the flexibility to present information in the most effective, readable format possible.
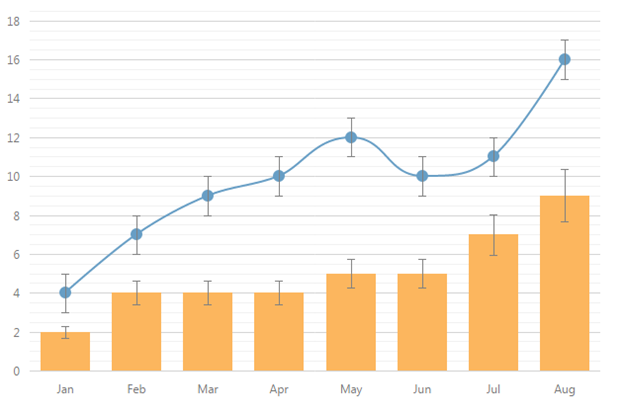
New HTML 5 Chart Widget Error Bars
DevExtreme v14.2 improves the statistical capabilities of our chart widgets with the introduction of Error Bars - designed so you can map values with deviations and to use standard statistical functions for calculating value errors, deviations and variances.
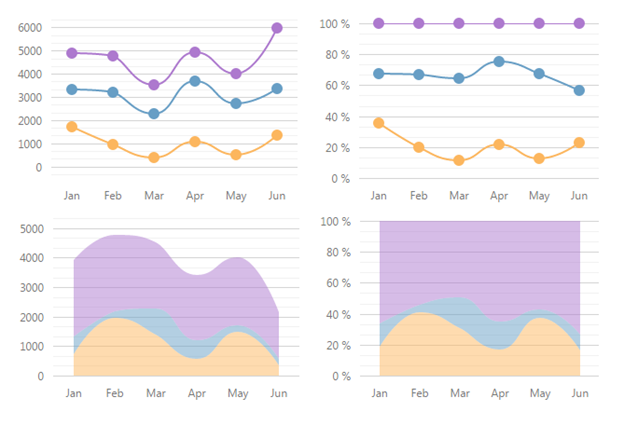
New HTML 5 Chart Widget Series Types
This release extends the collection of Chart Widget series types shipped with DevExtreme: As you can see below, stacked and full stacked versions of splines and spline areas are now supported.
Touch Enabled Zooming and Scrolling
In previous versions, we recommended the use of our HTML 5 Range Selector Widget to zoom and scroll charts with a long argument axis. Though the Range Selector remains a powerful UI metaphor, this release offers an alternative approach to zoom/scroll the contents of your chart. This new implementation is designed to allow the use of touch gestures and the built-in chart scroller to zoom/scroll as needed.
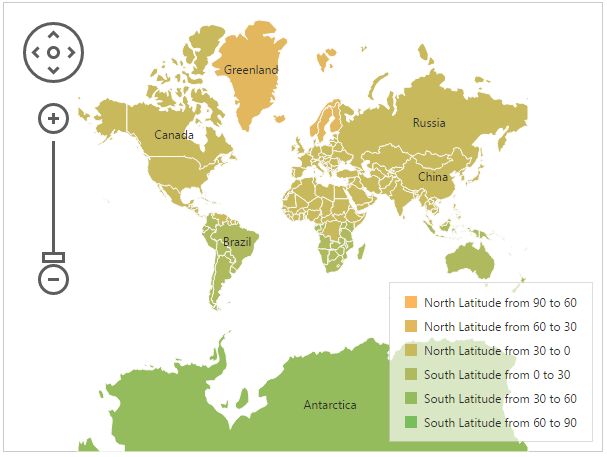
HTML 5 Vector Map Widget
With this release, Vector Map areas support the use of labels. In addition, you can now use color differentiation to visually demonstrate the values of a specific parameter that characterizes individual areas.
You can also use markers with color and size differentiation to help illustrate a specific parameter.
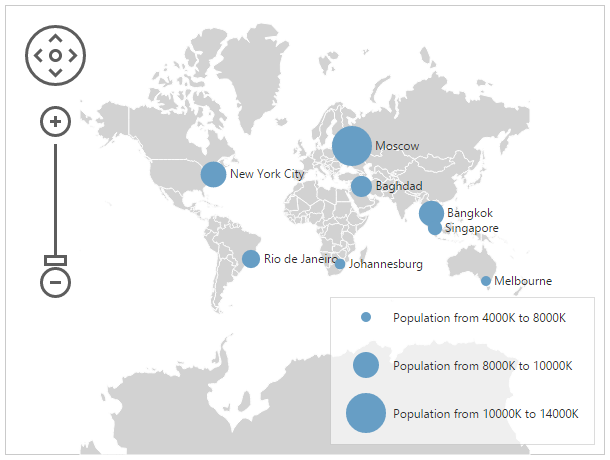
And as you've probably noticed by now, DevExtreme v14.2 allows you to add a legend to the HTML 5 Vector Map Widget in order to provide details on the color used and size diapasons.
Improved Performance
We remain fully committed to building the most powerful HTML 5 Charting Library on the market. To that end and as a result of modifications to our rendering engine, v14.2 is up to 50% faster than previous versions of DevExtreme.
Free DevExpress Products - Get Your Copy Today
 Ray Navasarkian (DevExpress)