As you already know, we've officially released v15.1 and among the new features we're shipping in our Charting libraries for WinForms and WPF is the ability to associate visual information to charts using colors.
In order to provide this functionality, Color (for WinForms) and Brush (for WPF) properties have been added to the SeriesPoint class.

v15.1 also includes support for Colorizers, allowing you to provide a color from data source's data members. At present, our Chart Control ships with the following predefined colorizers.
- Color Object Colorizer – Provides a color object to series points when the data source and its data type can be converted to a color (such as an integer value or string - representing color name or the color).
- Key-Color Colorizer – This colorizer allows color selection based on a key.
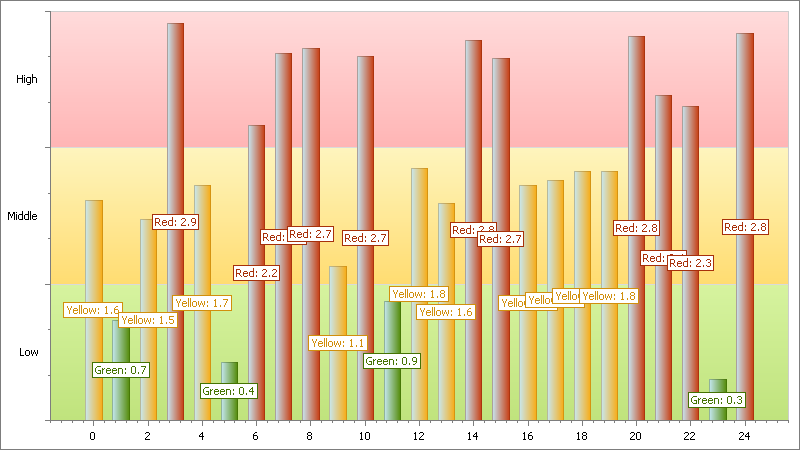
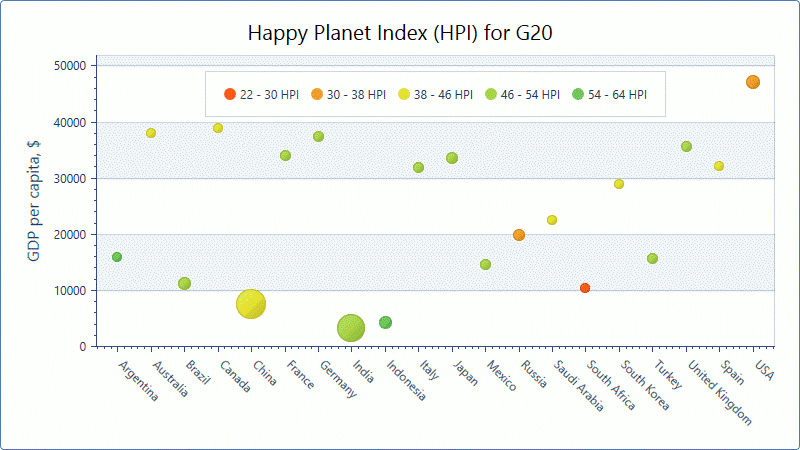
- Range Colorizer – Use this colorizer if you want to select a color based on numeric values within a range.
To colorize data, assign the selected colorizer to the Series.Colorizer property and specify the ColorDataMember property value of the series. This data member will be processed as a color item by the Color Object Colorizer, as a key by the Key-Color Colorizer and as a numeric value by the Range Colorizer. In addition to series points colors, colorizers can provide information to legends to effectively explain the actual meaning of colors used.
The following code snippets demonstrate use of colorizers for both our WinForms and WPF Chart Controls.
WinForms
(C#)
//
Prepare colorizer for a bubble series.
Palette palette = new Palette("Custom");
palette.Add(Color.FromArgb(0xFF5A19), Color.FromArgb(0xFF5A19));
palette.Add(Color.FromArgb(0xE5E335), Color.FromArgb(0xE5E335));
palette.Add(Color.FromArgb(0x6EC95C), Color.FromArgb(0x6EC95C));
RangeColorizer colorizer = new RangeColorizer() {
LegendItemPattern = "{V1} - {V2} HPI",
Palette = palette
};
colorizer.RangeStops.AddRange(new double[] { 22, 30, 38, 46,
54, 64 });
//
Create and customize a series.
Series bubbleSeries = new Series() {
DataSource = HpiData,
ArgumentDataMember = "Country",
ColorDataMember = "Hpi",
View = new BubbleSeriesView(),
Colorizer = colorizer
};
bubbleSeries.ValueDataMembers.AddRange(new string[] { "GDP", "Population" });
//
Add a bubble series to the ChartControl's Series collection.
chartControl1.Series.Add(bubbleSeries);
WPF
(XAML)
<dxc:BubbleSeries2D
DataSource="{Binding Source={StaticResource hpiData}, XPath=CountryStatistics}"
ArgumentDataMember="Country"
ValueDataMember="Product"
WeightDataMember="Population" ColorDataMember="HPI">
<dxc:BubbleSeries2D.Colorizer>
<dxc:RangeColorizer
RangeStops="22, 30, 38, 46, 54, 64" LegendTextPattern="{}{V1}
- {V2} HPI">
<dxc:RangeColorizer.Palette>
<dxc:CustomPalette>
<dxc:CustomPalette.Colors>
<Color>#FF5A19</Color>
<Color>#E5E335</Color>
<Color>#6EC95C</Color>
</dxc:CustomPalette.Colors>
</dxc:CustomPalette>
</dxc:RangeColorizer.Palette>
</dxc:RangeColorizer>
</dxc:BubbleSeries2D.Colorizer>
</dxc:BubbleSeries2D>
Here is the resulting chart...
Free DevExpress Products - Get Your Copy Today
The following free DevExpress product offers remain available. Should you have any questions about the free offers below, please submit a ticket via the
DevExpress Support Center at your convenience. We'll be happy to follow-up.
