DevExpress Dashboard - High Performance In Memory Data Processing (Coming soon in v15.2)
DevExpress Dashboard v15.2 will ship with a completely redesigned client side data processing engine. This new data engine reduces memory consumption and improves the speed of client-side data shaping operations (grouping, sorting and aggregation) by loading a compressed snapshots of aggregated data into memory. As you'll read in a moment, the improvement in memory consumption/performance is significant thanks to the following techniques:
- Data compression is used to reduce memory consumption. For instance, dictionary compression is used to replace common dimension values with integer key values.
- The Dashboard's new data grouping algorithm uses hash tables (with integer key values obtained during data compression). The use of key values means data grouping and sort operations are executed much faster.
- New multi-threading algorithms are used to perform independent operations. The Dashboard's data engine uses TPL (Task Parallel Library) to perform these operations.
We've also introduced strong typing for all operations within the data engine. This removes overhead expenses related to boxing/unboxing conversions.
Comparing v15.1 to v15.2
Seeing is believing and so here are a few test results that help illustrate the performance gains you'll find in DevExpress Dashboard v15.2.
Note: These results were gathered using Microsoft's Contoso Dataset and the underlying data source was formed using the following SQL requests:
select * from [dbo].[V_CustomerOrders] where ProductCategoryName = 'TV and Video' | Returns approximately 1.2M records.
select * from [dbo].[V_CustomerOrders] | Returns approximately 12M records.
Memory Consumption
To say that v15.2 reduces memory consumption might be an understatement.

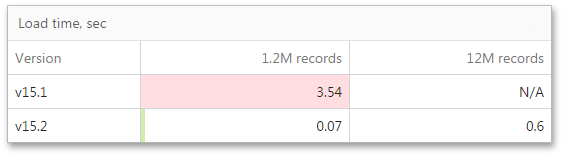
Binding/Loading
In this test, the Dashboard's List Box was bound to the ProductSubcategory dimension. As you can see below, we have a nearly 50x improvement from v15.1 to v15.2
In the test scenario below, the Dashboard's Grid was bound to the following dimensions and measures.
- Dimensions: ProductCategoryName, ProductSubcategory, Product
- Measures: Amount, Quantity (summary type set to Sum).
The power of the Dashboard's data processing engine speaks for itself - a 37x improvement in calculation speed.

In this last example, we measured load times for the Dashboard's Pivot Grid (column/row values expanded at all levels).
Row Dimensions: ProductCategoryName, ProductSubcategory, Product
Column Dimensions: Region, CalendarYear
Measures: Amount, Quantity (summary type set to Sum)
Again, the results speak for themselves - calculation speed has improved 32x.

Free DevExpress Products - Get Your Copy Today
 Ray Navasarkian (DevExpress)