HTML5 Chart and Data Visualization Widgets - Enhancements (Coming soon in v15.2)
Our upcoming release includes a number of important enhancements/features to our HTML5 data visualization widgets - making them faster and more flexible than ever before.
Performance
We've been hard at work tuning performance and with v15.2, HTML5 Chart rendering has been improved significantly...In some instances up to 3 times faster.

Quick Side Note: All DevExtreme HTML5 Data Visualization widgets now allow you to specify a Tile and Subtitle.
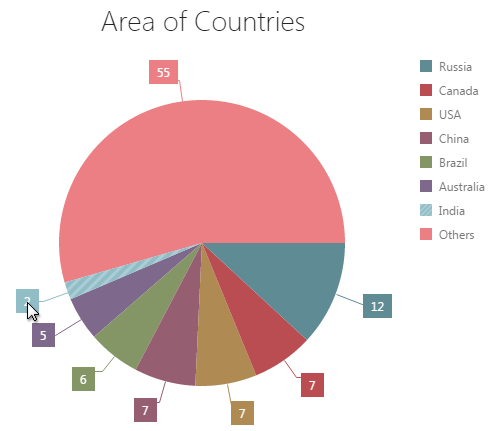
Multi-Series Pie Charts
With this release, our Pie Chart widget can display multiple series. Series are displayed as nested rings, which gives end-users an easy way to detect even the slightest differences between point values.

You'll find that we've made it easy to incorporate this new feature in your next web/mobile app - Simply specify several series objects as follows.
series: [
We've also made it easier to analyze information with the HTML5 Pie Widget. You can now interact with a point using its label; necessary when a point value is too small and is displayed as a thin pie or doughnut sector.
Vector Maps
With v15.2, our HTML5 JS Vector Map widget gets support for the following map projections:
Mercator
Equirectangular
Lambert
Miller
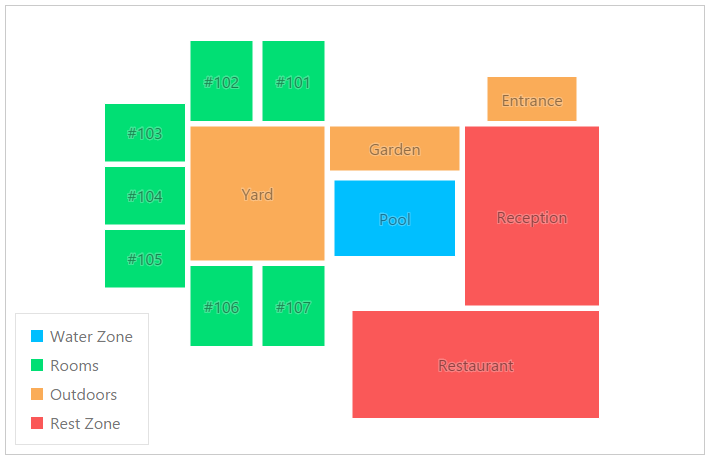
You'll find these projections useful for a number of use-case scenarios - for instance, a map with a custom projection for a floor plan:
Another new HTML5 Vector Map feature is support of unlimited layers. As you'd expect with this capability, you can now display additional information on your map using layers (areas, markers and lines). Map layers accept GeoJSON formatted data.
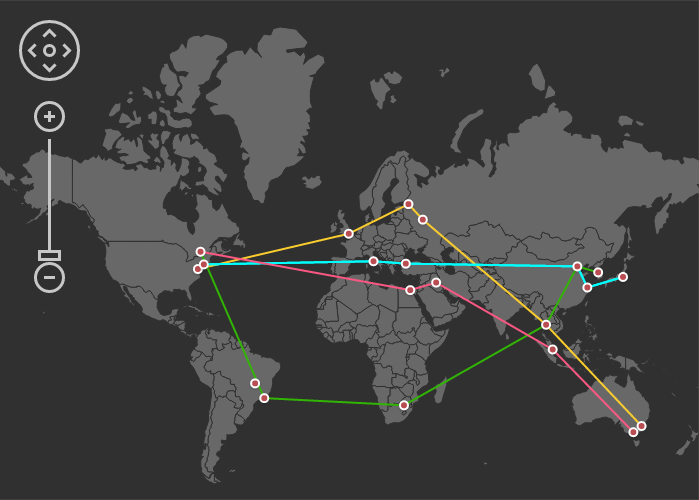
You can allow users to select a single layer element or multiple elements. Layer elements support hovered states and can display a tooltip on hover. In addition, you can group layer elements by color or size and display the legend based on grouping.
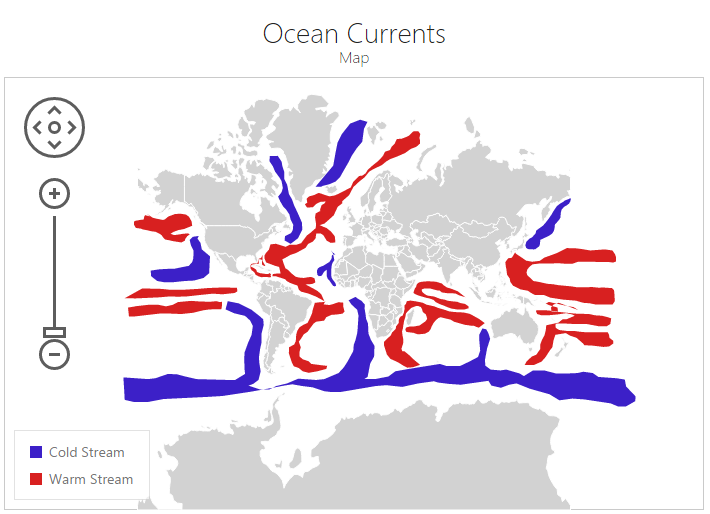
As is evident in the screenshots above, when used together, multiple layers along with customizable projections provide you a broad range of data visuzliation capabilities/options.
============================
Tell us what you think. We want to hear your thoughts on these new features.
Free DevExpress Products - Get Your Copy Today
 Ray Navasarkian (DevExpress)