Performance and Memory Milestones in CodeRush and Refactor! Pro - Preview of 9.2

The IDE Tools team has been spending a great deal of time making CodeRush and Refactor! Pro run even faster and with less memory. With every release since 3.2.3, customers have noticed improvements in speed. And it's no different for CodeRush 9.2, expected later this quarter.
Performance
Our primary focus for performance in this release has been solution load times. Specifically, we want to reduce the time it takes to go from specifying a solution to open in Visual Studio to the ability to refactor anywhere that a solution (we call this "zero-to-refactor" time). Refactoring anywhere means CodeRush has a full understanding of all the code in the entire solution.
To give you an idea of what you can expect in CodeRush 9.2, we took some measurements of this zero-to-refactor time with three of our internal DevExpress solutions. Two of these solutions are among our largest: DX Controls (8000+ files, anyone? Holy crap!) and XAF. The third is a medium-sized project, XtraScheduler. The table below gives you an idea of their respective sizes using a variety of metrics:
|
|
DX Controls |
XAF |
XtraScheduler |
|
# of Projects |
51 |
54 |
9 |
|
# of Files |
8,056 |
1,980 |
660 |
|
# of Types |
17,351 |
4,295 |
2,235 |
|
# of Members |
209,384 |
32,250 |
22,215 |
|
Lines of Code |
1,831,086 |
255,759 |
389,954 |
|
Source Size |
84MB |
16MB |
18MB |
How do your solutions compare to these?
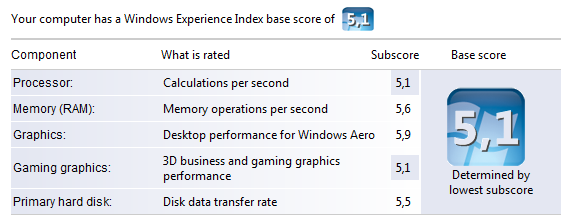
Some details on the test machine:
Processor
Intel Core 2 Duo E6400, 2.13 GHz
Memory
2 GB
Hard disk drive
Seagate st3250824as, 7200 RPM
(8ms average seek time,
9ms average write time)
Operating system
32-bit Vista, SP1
And it's Windows Experience Index:
First Time Loads
When you first open a solution, CodeRush 9.2 parses it and caches important information using a background thread. The cache later improves the zero-to-refactor time for subsequent loads of the same solution.
The parse and cache-building times for first-time loads for each of the solutions in CodeRush 9.2 are about the same as the old parse times (and no cache building) for CodeRush 9.1:
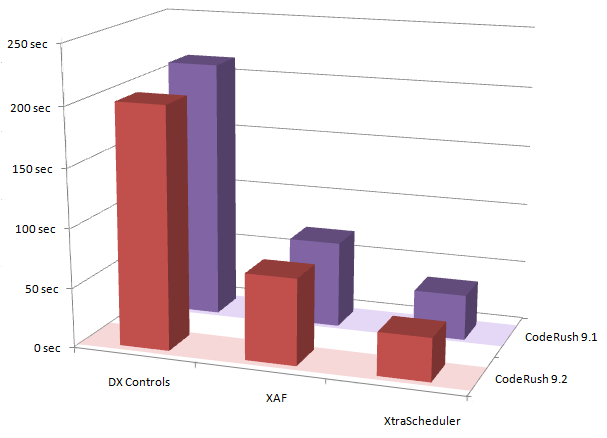
Even though CodeRush 9.2 performs additional functionality on the first-time load (e.g., parsing the code and building the cache), the team has actually found ways to improve the parsing speed sufficiently so as to have an overall effect of marginally reducing the zero-to-refactor time.
By the way, if you are looking at that 200-second parse and cache-building time for the DX Controls project and on the verge of freaking out, you may find relief in the following:
-
That time is from zero (no solution open) to the ability to instantly initiate a refactoring anywhere (no build required).
-
This is all happening in a background thread. Visual Studio remains responsive during this time.
-
The DX Controls solution declares over seventeen thousand types and over two hundred thousand members. It's 84MB of source code and nearly two million lines of code long. This solution is significantly larger than most solutions out there.
- This cache-construction stage only occurs once -- the first time you open a solution without a cache.
-
This zero-to-refactor performance for first-time solution loads is actually comparable if not significantly faster than the competition.
Subsequent Loads
For subsequent solution loads after the cache is built, the story is even better:
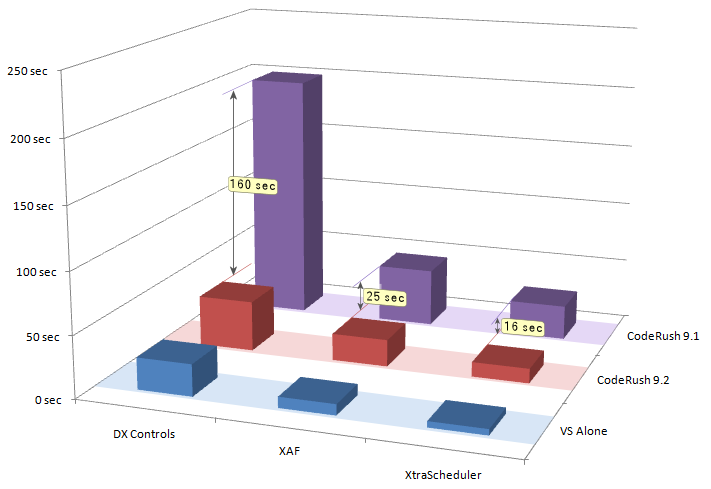
Notice that once the cache is built, subsequent times to load a solution and get from zero-to-refactoring for CodeRush 9.2 (middle row in red) approach those of Visual Studio's normal load time for the solution (front row in blue).
The bottom line is CodeRush 9.2 gets you to that point of total code understanding where you can refactor anywhere significantly faster than CodeRush 9.1. In some cases up to five times faster.
Memory Consumption
Remarkably, the memory story is even more compelling than the performance story.
The data below shows total Task Manager memory after loading one of these large solutions and reaching that point where we're able to refactor anywhere in the solution (all source code has been parsed). Measurements were taken with Visual Studio 2008 alone (no add-ins), and with CodeRush 9.1 and CodeRush 9.2.
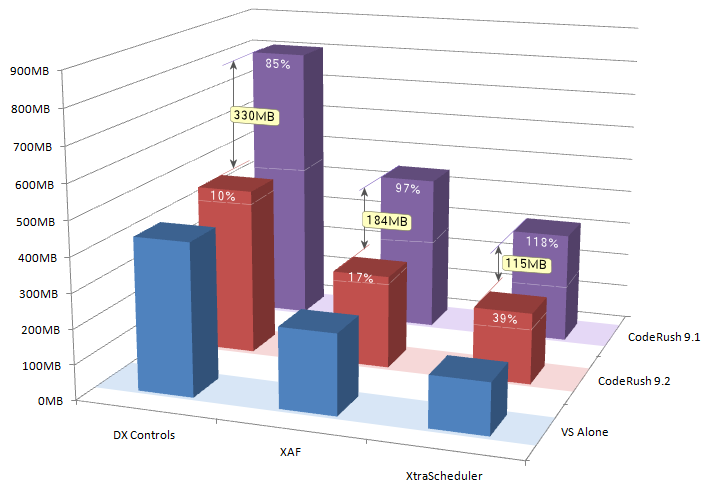
By the way, if you're using a competing IDE productivity tool and wondering how much memory that other tool might be consuming, it's likely to be very close to the memory consumed by CodeRush 9.1 (see the back row in purple).
Notice the significant drops in memory consumption produced by CodeRush 9.2 (middle row in red) compared to the memory consumption of CodeRush 9.1 (or your other IDE productivity tool). The savings in memory is huge, especially considering the size of these projects and the fact that this memory also holds all the assemblies required simply to keep CodeRush (and Refactor! Pro) running.
The percentage numbers in white near the top of each bar show how much additional memory is required by CodeRush (to represent the entire solution as well as its referenced assemblies) as a percentage of that needed by Visual Studio alone (if you didn't have CodeRush installed).
Whereas CodeRush 9.1 (in purple) requires about double the memory Visual Studio needs, CodeRush 9.2 requires substantially less. We expect most customers with large solutions to see a reduction in memory consumption of at least 100MB. Customers with very large solutions (e.g., 2000 files and up) should see even greater savings.
Can I Try This Now?
Yes you can. Between now and the release of CodeRush 9.2, CodeRush customers can request a daily build of CodeRush 9.2 from support@devexpress.com.