Browse by Tags
The details in this post apply to the WinForms Chart and WPF Chart controls, the WebChartControl in ASP.NET WebForms , and the control created by the DevExpress.Chart() function when using ASP.NET MVC Extensions. Additional flexibility for MeasureUnit...
Oliver Sturm (DevExpress)
20 April 2018
For our Windows Forms Chart Control , performance is one of our highest development priorities. In the upcoming v18.1 release, we had the goal of improving rendering performance for High DPI resolutions. We also optimized the internal data processing...
Oliver Sturm (DevExpress)
17 April 2018

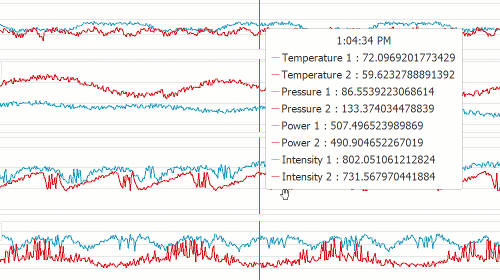
In all walks of programming life, performance matters. It is especially true when you are using third-party controls where you have no influence over how quickly the controls and their content renders on the screen. We agree and have always considered...
Julian Bucknall (DevExpress)
4 June 2015
I think the subject line of this post is self-explanatory...but to tease you even further, we've prepared a short video.... http://tv.devexpress.com/#WinFormsMultiTouchSupport The video demontrates multi-touch enabled versions of our WinForms Grid, WinForms...
Ray Navasarkian (DevExpress)
6 September 2011
One of the pleasures of being in a downtime at a show like DevConnections is that you can browse the What’s New of our various products through the new Demo Center. Yes, I know I get notified of the new features well in time, but there’s nothing like...
Julian Bucknall (DevExpress)
4 November 2010
Bubble charts are an interesting way of showing data that has a third dimensional component. You map two dimensions along the usual X and Y axes, and then the third dimension is displayed as a shape, usually a filled circle; hence, "bubble") at the data...
Julian Bucknall (DevExpress)
28 October 2008
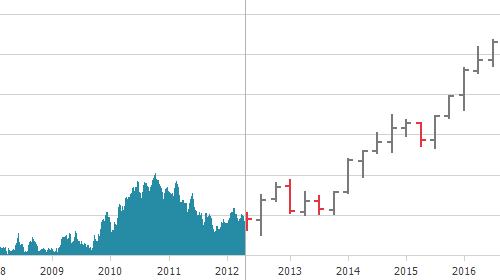
A new feature in our charting product, XtraCharts, for both the WinForms and ASP.NET platforms, are Fibonacci indicators for financial charts. Since these are not well-known outside financial circles, let me quickly introduce what they are. Fibonacci...
Julian Bucknall (DevExpress)
26 October 2008
One of the new features in XtraCharts for v2008 vol 3 is the addition of a logarithmic scale. Here's a chart showing the population of various regions of the Earth as it would have been rendered prior to v2008 vol 3 of DXperience: Notice how the line...
Julian Bucknall (DevExpress)
24 October 2008
It's certainly turning into a charting marathon in my blog recently, and why not? XtraCharts is just so cool. Anyway, Jeff has completed the editing of the next video in my series on the various chart types in XtraCharts, and so I present it without further...
Julian Bucknall (DevExpress)
27 August 2008
A request came in just recently, prompted by my video introducing the three major new features in XtraCharts v2008 vol 2: how do you set up a couple of series and display them in separate panes. "Programmatically" came the kicker before I could quip with...
Julian Bucknall (DevExpress)
27 August 2008
More Posts
Featured Posts
Paul Usher (DevExpress)
DevExpress Developer Survey — AI Impact, Regulatory Compliance, Upgrade & General Product Experience
Dennis Garavsky (DevExpress)
Alex Chuev (DevExpress)
Popular Topics
- Roadmap
- v26.2 - Next Release
- v26.1 - Latest Release
- Prerelease/EAP
- .NET 10
- AI
- Security
- DevExtreme
- Blazor
- ASP.NET
- Office File API
- XAF UI/Web API Service
- .NET MAUI
- WinForms
- WPF
- Reporting
- BI Dashboard
- VCL