Blazor Charts — Histogram, Drill-Down, Export to PDF & API Enhancements (v22.1)

As you may already know, we extended the capabilities of our Chart control for Blazor in our upcoming major update (v22.1). For a complete list of new features, please refer to the following web page: What's New in v22.1 - Blazor Charts.
In this post, I will highlight new Blazor Chart-related capabilities we use to create our demos.
Histogram
Histograms allow you to visualize the distribution of numerical data. We created our Histogram demo to demonstrate how you can configure chart settings to plot a histogram.
This demo displays two series plotted using two axes. Prior to v22.1, axes were always synchronized. Since this particular demo contains large differences in range values, synchronization can distort data presentation. v22.1 includes a new DxChart.SynchronizeAxes property that disables axis synchronization.

In the demo, we used a bar series to display histogram bins that do not have gaps between one another. We also used other new options to control bar width (DxChart.BarGroupPadding and DxChartBarSeriesBase.BarPadding) and configure the histogram’s bin width.
See the following demo to review new options: Histogram
Drill-Down Chart
Drill-down charts allow you to analyze information across different levels of hierarchical data. To drill down, we must obtain the source data used to display the current data hierarchy level and then pass it to visualize the parent or nested hierarchy level. We implemented a new IChartSeries.Data property to make that possible.
Refer to the following demo to learn more about this feature: Drill Down 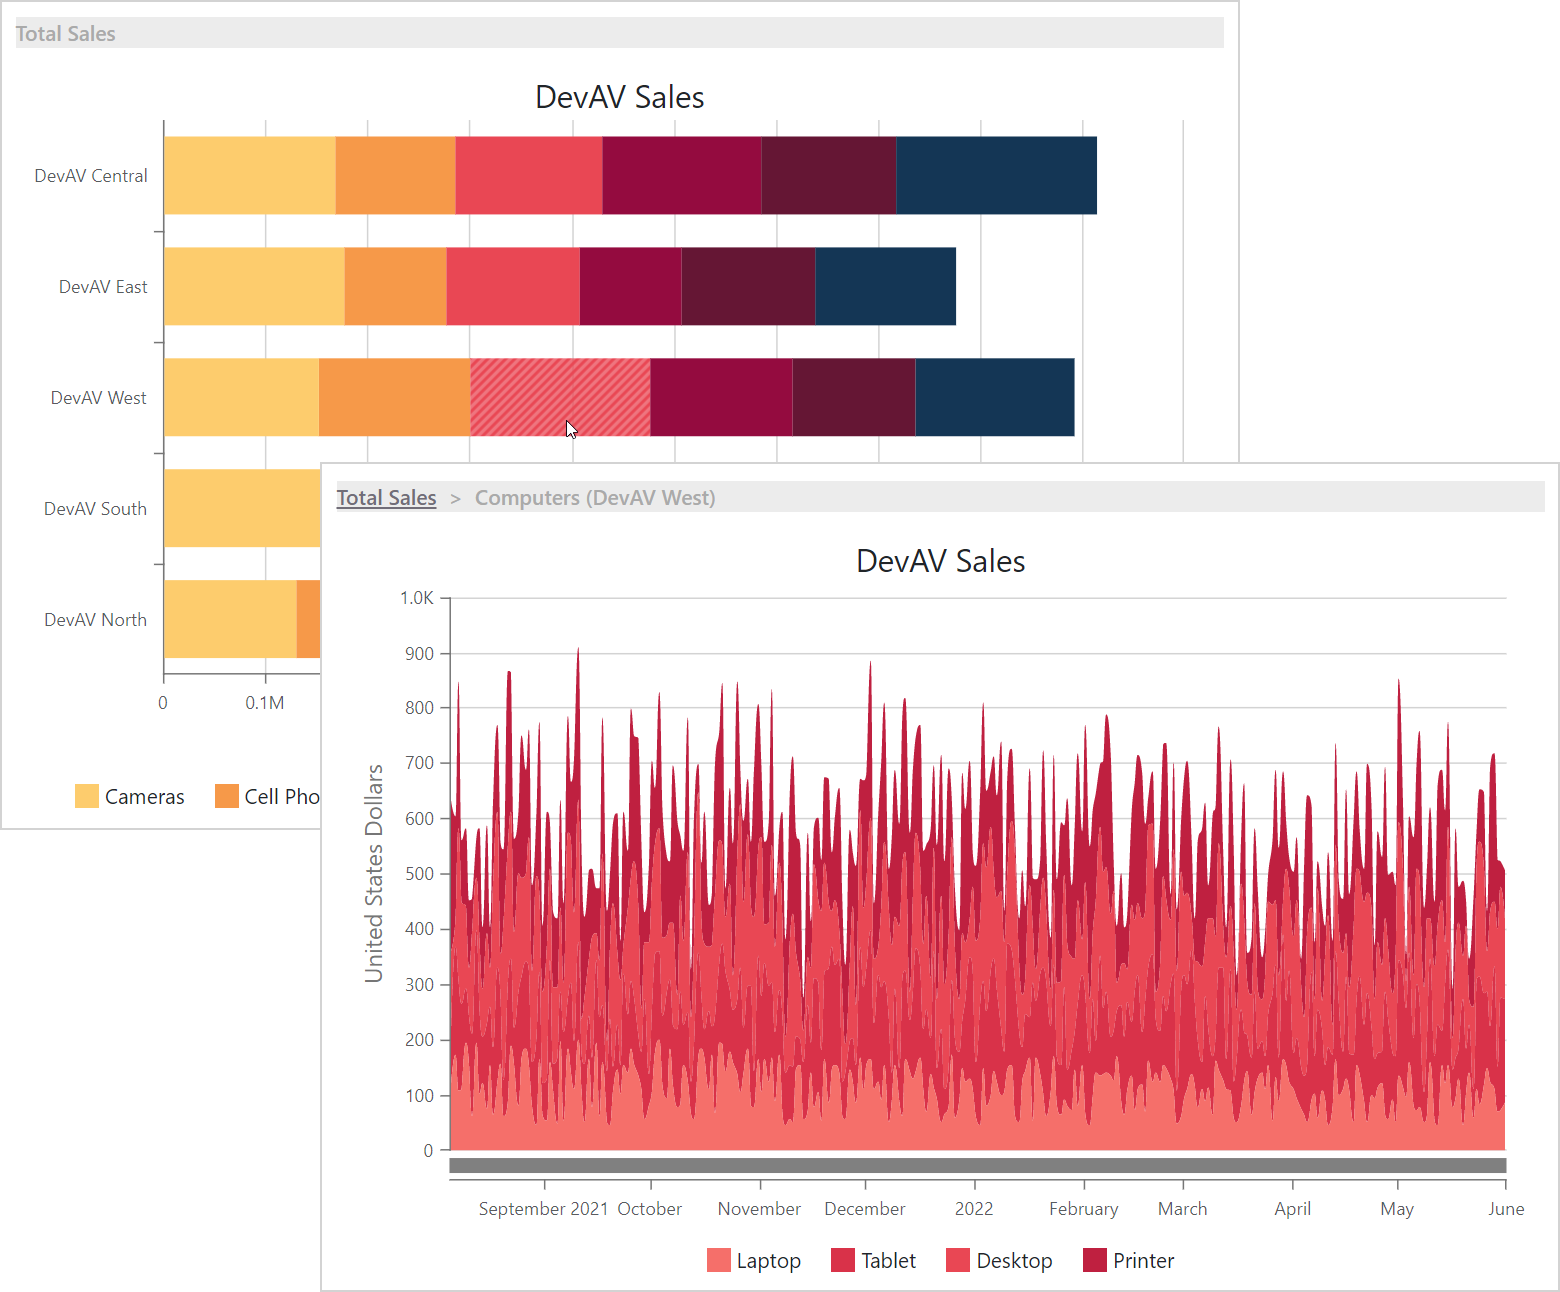
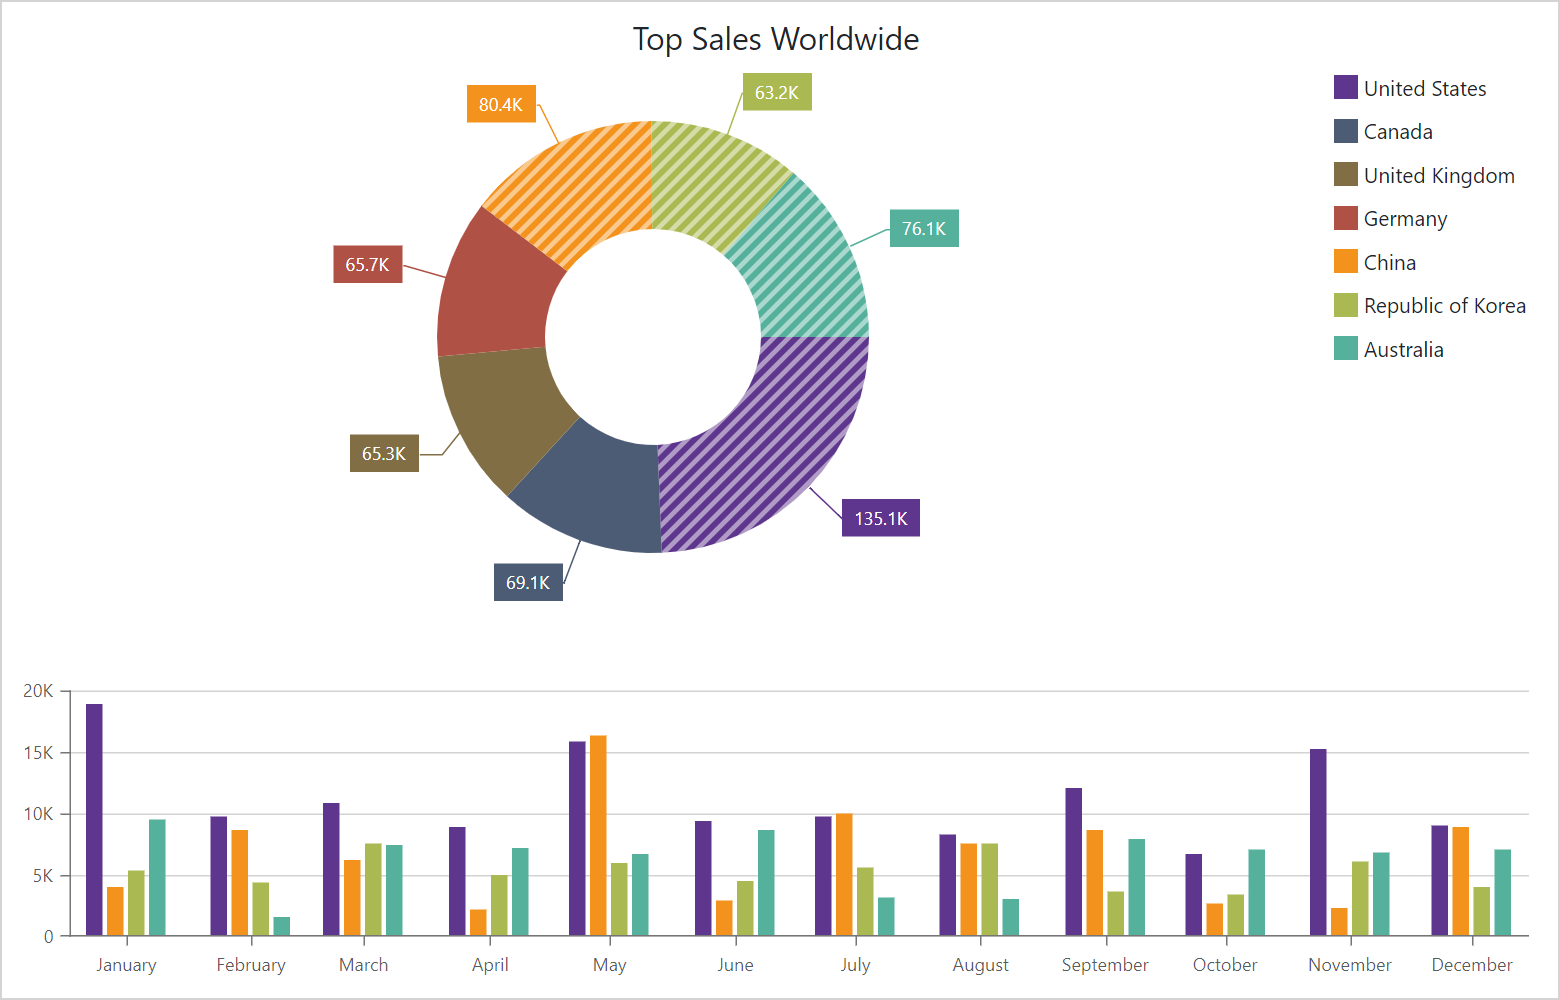
Selection
Users can now select series points and entire series in the DxChart and DxPieChart. This feature can be of value when you wish to display detailed information for a selected point or series in another chart or other component (for example, in a DxGrid).
In the Selection demo, users can select multiple pie sectors. The DxPieChart.PointSelectionMode property allows you to enable multi-select for pie sectors. Use the DxPieChart.SelectionChanged (DxChart.SelectionChanged) event to respond to user selection actions.
In this demo, once you select a pie sector, it is added to a collection of selected items. This collection is used to filter series in the bottom chart and to only select series that correspond to sectors selected in the pie.
To review the new API, please review the following demo: Selection
For more information about selection, refer to the following help topics: DxChart Selection | DxPieChart Selection
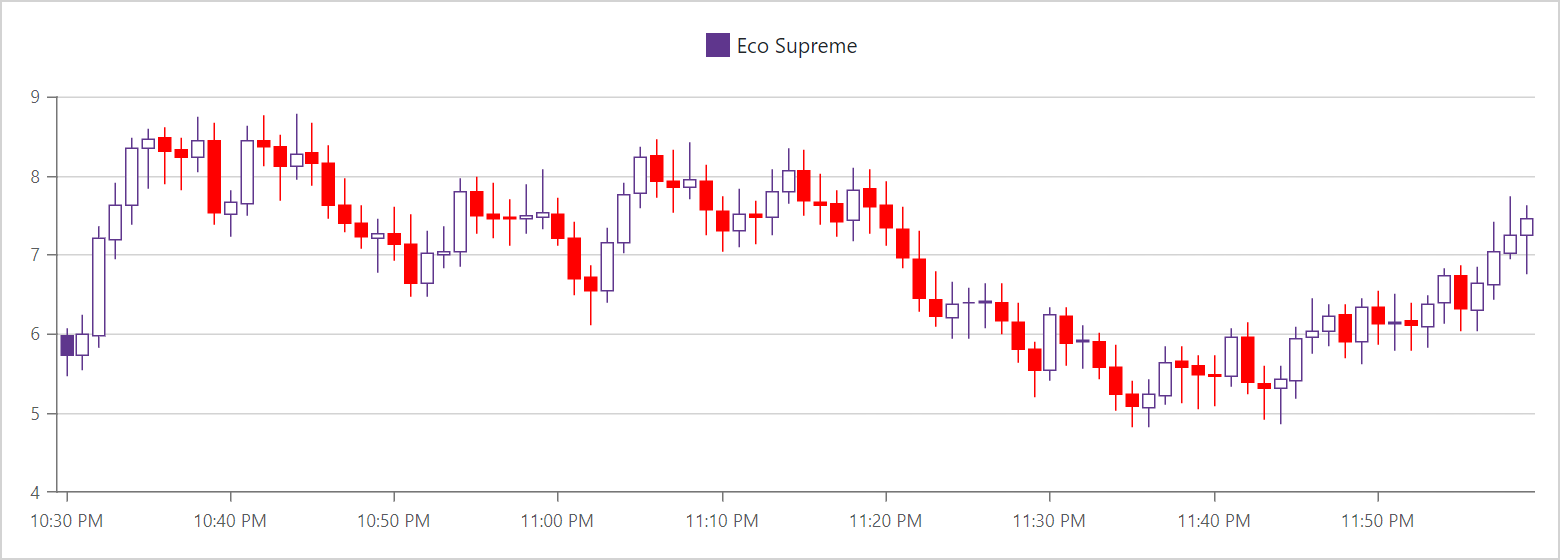
Financial Chart
v22.1 includes simplified financial chart configuration options. You can now use the OpenField, HighField, LowField, and CloseField properties to specify the source field for each value separately. This approach makes chart creation clearer and more straightforward. To see why, please compare the following code samples:
v21.2
    <DxChartCandlestickSeries ValueField="@((BargainDataPoint i) => i.Price)"
                        ArgumentField="@(i => new DateTime(
                                                 i.DateTimeStamp.Year,
                                                 i.DateTimeStamp.Month,
                                                 i.DateTimeStamp.Day,
                                                 i.DateTimeStamp.Hour,
                                                 i.DateTimeStamp.Minute,
                                                 0) )"
                        Name="Eco Supreme" />
v22.1
    <DxChartCandlestickSeries OpenField="(StockDataPoint sdp)=>sdp.Open"
                        HighField="sdp=>sdp.High"
                        LowField="sdp=>sdp.Low"
                        CloseField="sdp=>sdp.Close"
                        ArgumentField="@(sdp => new DateTime(
                                                       sdp.DateTimeStamp.Year,
                                                       sdp.DateTimeStamp.Month,
                                                       sdp.DateTimeStamp.Day,
                                                       sdp.DateTimeStamp.Hour,
                                                       sdp.DateTimeStamp.Minute,
                                                       0) )"
                        Name="Eco Supreme" />
To learn more, please explore the following demo: Candlestick
Range Chart
The enhancement mentioned in the previous section is also available for range series. v22.1 allows you to define fields that store start and end values separately for each value (StartValueField and EndValueField properties).
    <DxChartRangeAreaSeries StartValueField="(DetailedWeatherSummary  i) => i.MinTemperatureF"
                            EndValueField="i=>i.MaxTemperatureF"
                            ArgumentField="i => new DateTime(2000, i.Date.Month, 1)"
                            Name="Temperature, °F"
                            Filter="@((DetailedWeatherSummary  i) => i.City == "HILO")">
        <DxChartSeriesLabel Visible="true"
                            Format="@(ChartElementFormat.FromLdmlString("0# °F"))" />
        <DxChartSeriesPoint Visible="true" />
    </DxChartRangeAreaSeries>
Refer to the following demo to learn more: Range Area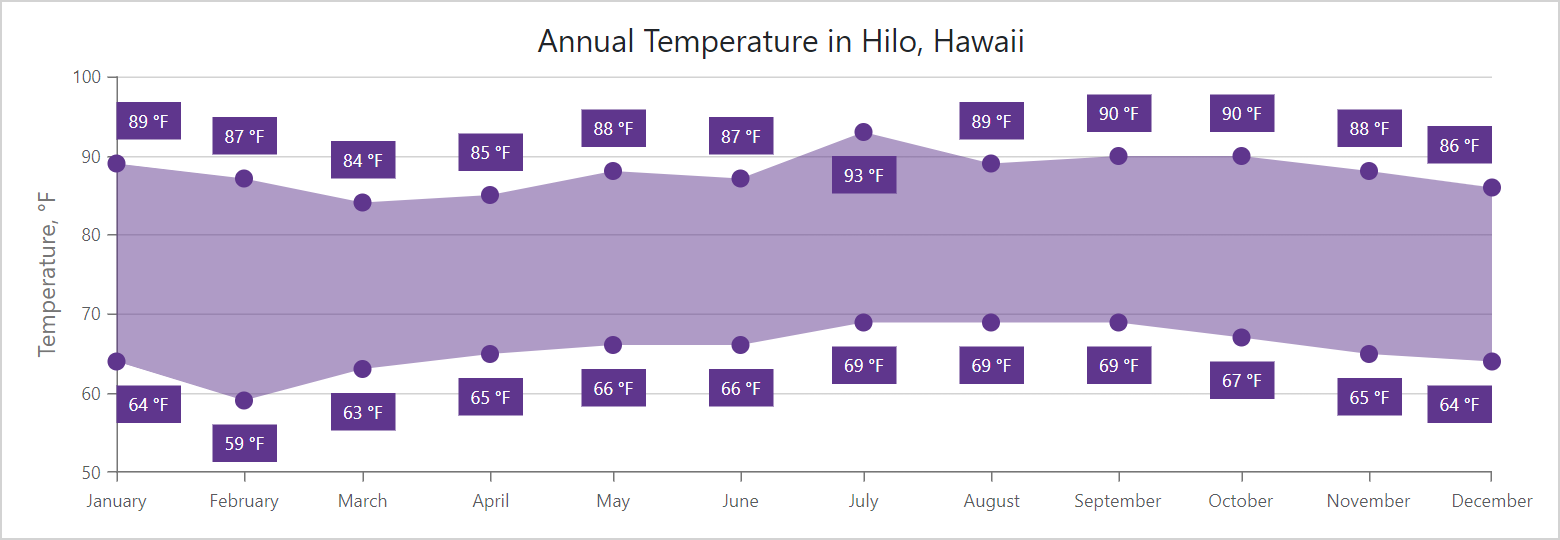
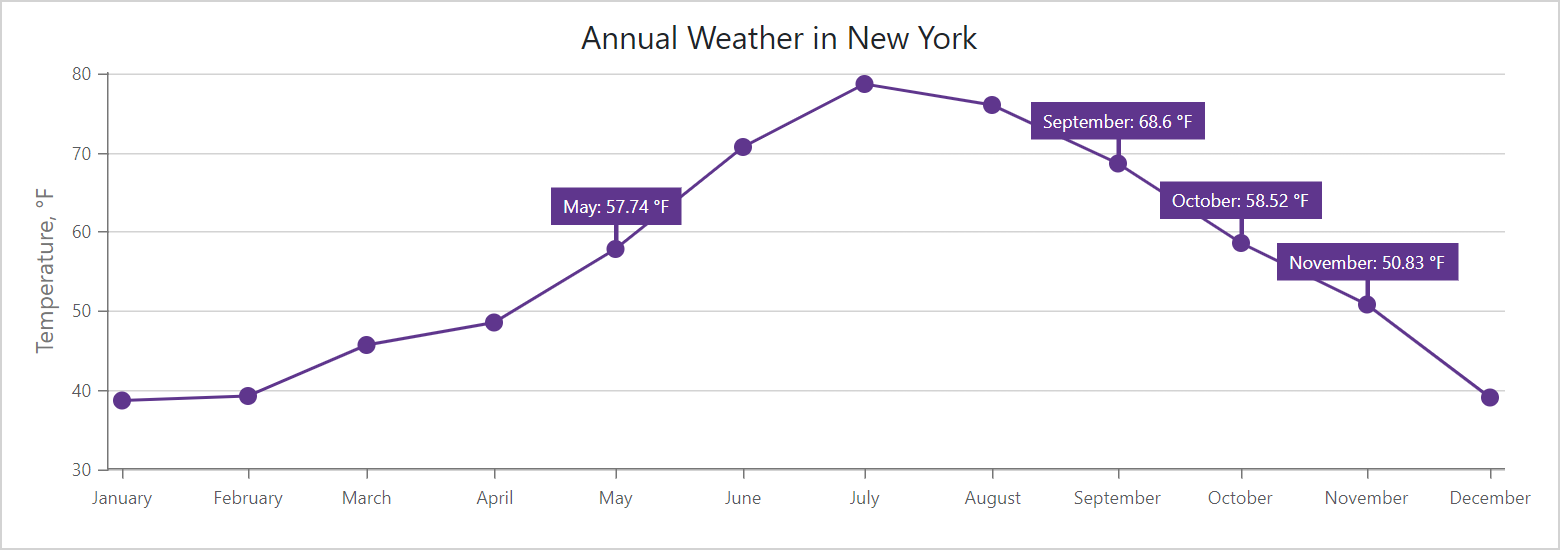
Series Label Format
v22.1 extends formatting capabilities for series labels and adds a new DxChartSeriesLabel.FormatPattern property to format labels as needs dictate. For example, you can now incorporate point arguments within labels. The following labels display a point argument using a month format and point values with two digits after comma:
        <DxChartSeriesLabel Position="RelativePosition.Outside"
                            FormatPattern="{argument:MMMM}: {value:#.##} °F">
            <DxChartSeriesLabelConnector Visible="true"
                                         Width="3" />
        </DxChartSeriesLabel>
To learn more, please explore the following demo: Series Label Customization
Your Feedback Matters
Are you currently using our Blazor Chart components? If so, please take a moment to tell us how we can better serve your needs.
Free DevExpress Products - Get Your Copy Today
 Dmitry Tokmachev (DevExpress)