DevExpress BI Dashboard — Trend Indicators (v23.1)

As you may already know, DevExpress BI Dashboard v23.1 supports use of Trend Indicators within Dashboard Chart items.
Trend indicators help communicate data trends over time – allowing users to uncover patterns and analyze complex datasets more effectively.
Our BI Dashboard supports the following trend indicators (across all supported platforms):
- Trend line (ChartTrendLine): displays the general direction of associated points (often used to identify existing data trends and forecast future trends).
- Regression line (ChartRegressionLine): visualizes data using a mathematical formula that minimizes the distance between the line itself and associated data points (often used to model the relationship between two variables and can be used to make predictions about one variable based on the value of the other variable).
- Custom Indicator (ChartCustomIndicator): allows you to add your own indicator type to visualize sales trends and render financial patterns.
You can create, edit, and delete these indicators both via the Dashboard's UI and in code.
End-User Experience
End-users can manage a trend indicator collections via the Dashboard's UI.
In the Web Dashboard designer, click Trend Indicators in the Options dialog to open the Trend Indicators editor.

In the WinForms Dashboard designer, click the Trend Indicators button in the Ribbon's Analysis group (Data Ribbon page). This command invokes the Trend Indicators editor dialog. The editor allows users to create/edit/delete a trend indicator.
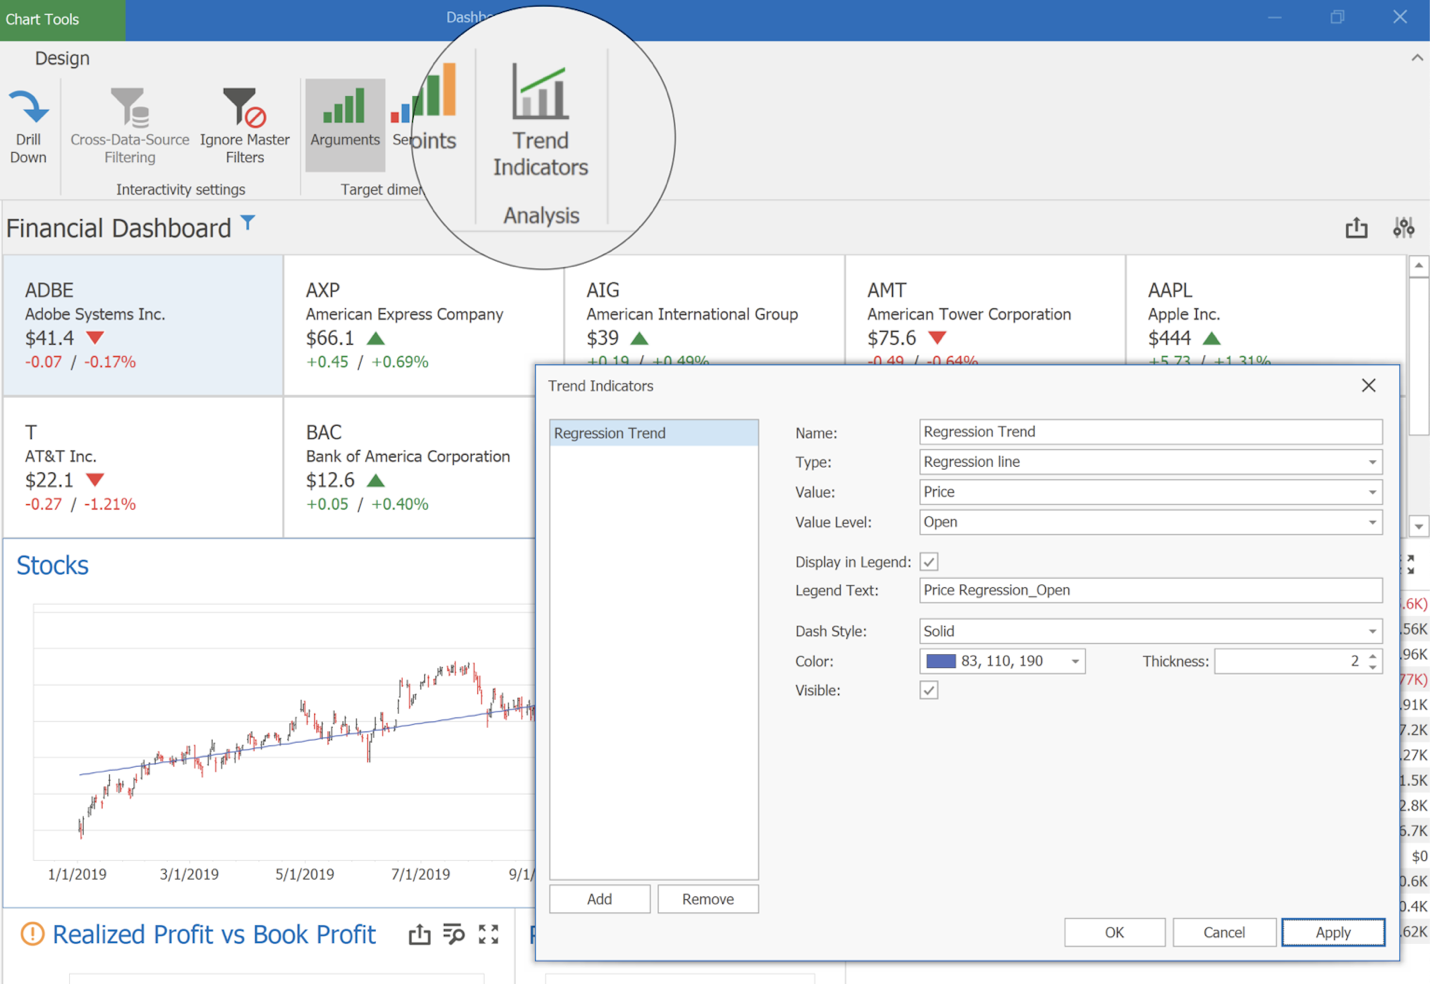
A new indicator is generated using default settings. Users can change indicator type, appearance setting, or settings specific to the chart series type (for example, users can select the values with which financial series indicators will be calculated: open, high, low, or close).

Refer to the following help topics for more information:
Runtime
At runtime, you need to create a ChartTrendLine or ChartRegressionLine object and add it to ChartDashboardItem.Indicators. Once complete, use the API listed below to specify indicator settings.
This property is required and displays the indicator in a Chart dashboard item when you launch the application:
If you do not specify the following properties, default values will be used:
The following code snippet creates a “Sales Trend” indicator for an ASP.NET Core dashboard application:
using DevExpress.DashboardCommon;
using System.Drawing;
// ...
public partial class CustomIndicatorDashboard : DevExpress.DashboardCommon.Dashboard {
    public CustomIndicatorDashboard() {
        InitializeComponent();
        ChartDashboardItem chartItem = Items.First(x => x.ComponentName == "chartDashboardItem1") as ChartDashboardItem;
        ChartTrendLine trendLine = new ChartTrendLine();
        SimpleSeries simpleSeries = chartItem.Panes[0].Series[0] as SimpleSeries;
        if (simpleSeries != null) {
            trendLine.Value = simpleSeries.Value.UniqueId;
        }
        trendLine.Name = "SalesTrend";
        trendLine.ValueLevel = DevExpress.XtraCharts.ValueLevel.Value;
        trendLine.Color = Color.Orange;
        trendLine.LegendText = "Sales Trend";

        chartItem.Indicators.Add(trendLine);
    }
}
Add a Custom Indicator Type
You can create your own custom indicator type to address a specific business requirement:
- Create a ChartCustomIndicator descendant that accepts a collection of data points, evaluates values, and returns resulting points. These points are used to draw the indicator.
- Register the resulting type in IndicatorFactory to make this class available as an indicator type.
If using the Web Dashboard, register ChartIndicatorsExtension before the control is rendered (to add the custom indicator type to the Trend Indicators editor).
The following code snippet implements/registers a “Moving Average” custom indicator type in an ASP.NET Core dashboard application:
using DevExpress.DashboardCommon;
using DevExpress.DashboardCommon.ViewerData;
using System.Collections.Generic;

namespace asp_net_core_dashboard_control_trendline_indicators.Data {
    public class MovingIndicator : ChartCustomIndicator {
        protected override Dictionary<AxisPoint, object> Calculate(Dictionary<AxisPoint, decimal?> values) {
            var items = new Dictionary<AxisPoint, object>(values.Count);

            var sum = decimal.Zero;
            var count = 0;
            foreach(KeyValuePair<AxisPoint, decimal?> point in values) {
                if(count == 0) {
                    items.Add(point.Key, null);
                } else {
                    items.Add(point.Key, sum / count);
                }
                sum += point.Value ?? 0;
                count++;
            }

            return items;
        }
    }
}
Call the Register method in your application before you save and load the dashboard (to serialize and deserialize the indicator within the dashboard's XML).
using DevExpress.DashboardWeb;
using TrendIndicators.Data;
namespace TrendIndicators {
public static class DashboardUtils {
public static DashboardConfigurator CreateDashboardConfigurator(IConfiguration configuration, IFileProvider fileProvider) {
DashboardConfigurator configurator = new DashboardConfigurator();
// ...
IndicatorFactory.Register<MovingIndicator>("Moving average");
return configurator;
}
}
}
Register ChartIndicatorsExtension before the control is rendered to add MovingIndicator type to the Trend Indicators editor.
function onBeforeRender(dashboardControl) {
// ...
dashboardControl.registerExtension(new DevExpress.Dashboard.Designer.ChartIndicatorsExtension(dashboardControl, {
customIndicatorTypes: [ {
type: 'MovingIndicator',
displayName: 'Moving Average'
}
]
}));
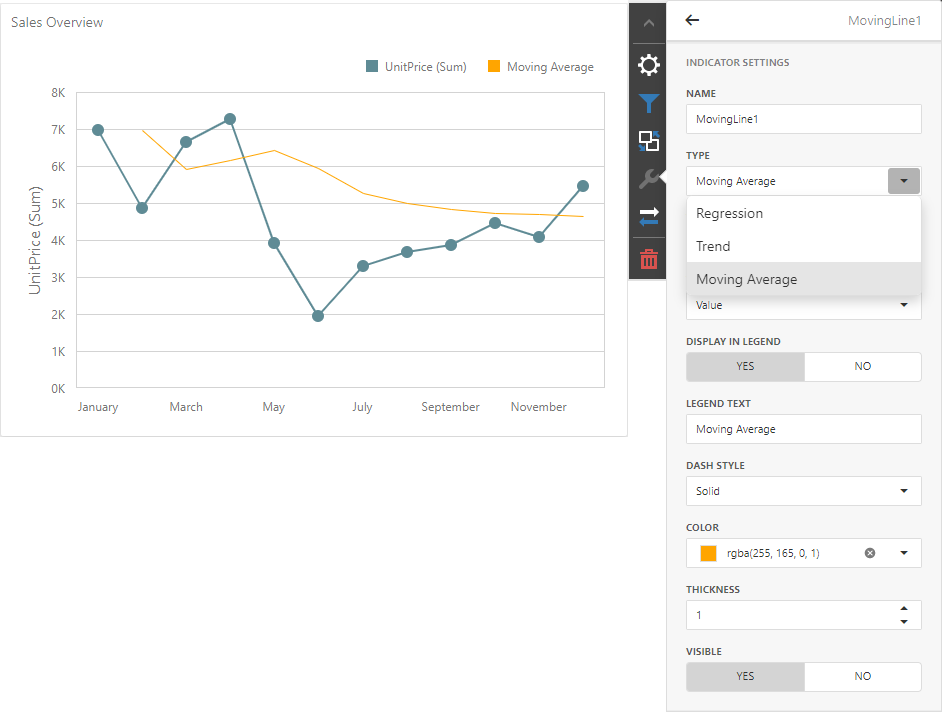
}Open the Trend Indicators editor and add a new trend indicator. If you followed this example, a new Moving Average type will be available in the UI:
If you'd like to incorporate custom trend indicators in your BI Dashboard, please review the following examples to learn more:
What's New in v23.1
If you have yet to review the features/capabilities introduced in our most recent major update, please visit the following webpage and let us know what you think of this release by responding to our online survey: Explore Our Newest Features (v23.1).
Free DevExpress Products - Get Your Copy Today
 Polina Fedorova (DevExpress)