I was chatting to our charting team lead recently and I asked him what
features did he think XtraCharts had that
would make it the choice for someone who needed charts in their
application. I know what floats my boat about the product, but then
again I don't have to write applications with charting in them, so I
was anxious to hear his side of the story, from interactions he's had
with customers either face-to-face or via support questions.
Funnily enough the first thing he came up with was ease of use. The
XtraCharts Wizard. Think of Microsoft Excel, he said, think of how you
create a chart there. You use a wizard.

Setting up charts can be difficult enough and you'd like to have a
"sandbox" whereby you can try things out before committing to a
particular look. So, our Charts Wizard gives you the chance to
experiment with settings and to see the results there and then on your
form in Visual Studio. Don't like what you see? Fine, just rollback
the changes or press Cancel, and start over again. We provide mini-
views, icons if you like, of what the chart would look like before you
apply that type or style, much easier than trying to remember what a
full-stacked spline area chart is. For best results the Wizard can be
used either in the traditional page-by-page wizard interface, or you
can jump directly to individual pages.
The developers implementing the charts shouldn't just be the ones to
have all the cool toys either, and so our Charts Wizard can be invoked
at run-time to enable your end-users to experiment with the look and
feel of their charts. Of course, once you allow that, it's a given
that you must be able to tweak and customize the wizard to do things
like localize the UI, hide elements of the UI you don't want your end-
users to use, or add new pages to the wizard for your particular chart
solution.
All told, the ability to use the same Chart Wizard at design-time and
at run-time is a strong indicator of the ease-of-use of XtraCharts.
OK, I said, what's next on your list? He thought a bit and came up
with the number of business chart types. This is possibly where I
might have started with my collection of XtraCharts benefits. Did you
know that, as of v2008 vol.1, we have 42 (yes, indeed, Douglas Adams
fans: 42)? Go on I say, what are they, expecting him to say something
like "pie, pie with one slice removed, pie with all slices removed"
and so on. Nope, he gave me the list:
2D-charts:
Area, Candlestick, Full-Stacked Area, Full-Stacked Bar, Full-Stacked
Spline Area, Line, Overlapped Range Bar, Point, Side-by-Side Bar,
Side-by-Side Range Bar, Spline Area, Spline, Stacked Area, Stacked
Bar, Stacked Spline Area, Step Line, Stock, Doughnut, Pie, Overlapped
Gantt, Side-by-Side Gantt, Radar Area, Radar Line, Radar Point, Polar
Area, Polar Line, Polar Point.
3D-charts:
Area Chart, Full-Stacked Area, Full-Stacked Bar, Full-Stacked Spline
Area, Line, Manhattan Bar, Side-by-Side Bar, Spline Area, Spline,
Stacked Area, Stacked Bar, Stacked Spline Area, Step Line, Doughnut,
Pie.
I must admit I goggled a bit at that and resolved to go back to the
charts demo and check them out. (Radar Area? Sounds fascinating.) He
pointed out that we have two visually distinct financial chart types:
Stock and Candlestick. Stock charts were familiar to me (they show
open/close and high/low prices as ticks on a vertical line, but
candlestick charts were new for me.
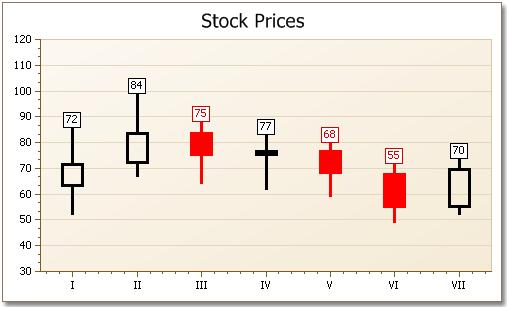
Nice.
The next item on his "why you should use XtraCharts" list was data
binding. To be precise, we can bind the X values and the series to any
datasource that implements IList or IEnumerable (which covers the
usual suspects like arrays and so on). Since a chart can show several
series, each series can be bound to a different data source. I said I
would expect that in a charting package and surely we had something
beyond that. Indeed we do he said, we have Series Templates.
This sounded interesting. Take a data source that has, conceptually,
several series in it distinguished by the value in a field of the data
source. So, for example, imagine a data source that has monthly sales
of widgets. You want to plot each widget's monthly sales on the same
chart. Rather than have to construct individual data series for each
widget for this job, you use a Series Template that automatically
filters each series by widget.
Next up: different chart types plotted on a single chart. I told him
to give me something interesting: surely all charting packages have
that and it's almost not worth discussing it.
He got a glint in his eye, what about secondary axes? OK, I said,
cautiously, surely this is similar to trumpeting that our soda cans
have ring-pulls? That our bicycles have two wheels? Surely everyone
does this? He said, sure, but we have no limits on the number of
secondary axes you can plot on the same chart, be they X or Y axes.
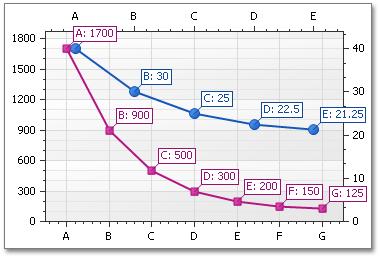
Useful in certain circumstances, I'd have to admit, although going
beyond two secondary axes or so might be difficult to read. But it's
nice to have the flexibility than just a single secondary Y axis say.
"Hot-tracking" he says. Ah, I know about this, I had a long chat with
a customer on the phone about this feature recently. Hot-tracking is
when you specify certain regions of your control as "hot" so that when
a mouse cursor moves over it or it gets clicked you get notified. You
can then display a tool-tip or invoke some action. Not only is this
feature available at run-time for your end-users, so you can quickly
implement drill-down and such features, but it's also available at
design-time so that you can easily edit particular chart elements
using the property grid.
It was at this point that we got into the normal list of features that
any charting product should have: automatic resizing of axes according
to points being added or removed, gradient and other fills for area
charts, skinning and theming, the usual image formats for saving
charts, unlimited points in data series, etc.
Free DevExpress Products - Get Your Copy Today
The following free DevExpress product offers remain available. Should you have any questions about the free offers below, please submit a ticket via the
DevExpress Support Center at your convenience. We'll be happy to follow-up.