JavaScript Charts & Gauges - Legend Customization, Label Word-Wrap, and Other Enhancements (v19.1)

Thanks to great feedback from users such as yourself, we’ve extended the capabilities of our JavaScript Chart and Gauge widgets with the following new features (v19.1).
Legend
- Customize Legend Items - Use the new
legend.customizeItemscallback to change the order, text, and visibility of legend items.
-
Legend Title - A legend title can now be specified and configured using the
legend.titleoption. You can customize the title's appearance and its position. You can also add a subtitle as needed. This new option includes the same capabilities as the widget's root title option. -
Legend in BarGauge - Our BarGauge widget can now display a legend.

Word-wrap
In v19.1, we added the wordWrap and textOverflow options to enable word-wrap within the Title and Chart axis, PieChart, Funnel, and TreeMap labels.
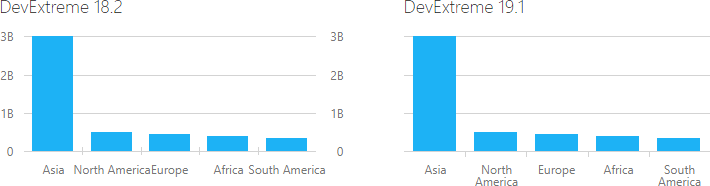
These options are similar to CSS word-wrap and text-overflow properties. Refer to the following two help topics for more information: wordWrap and textOverflow.
Other features
- Display a tooltip only when a point is hovered:
- Overlapped Bars - This feature allows you to create a TimeLine chart or an Overlapped Bar chart.

- Manage exported chart layout (layout by columns, etc.)
Angular, Vue, React, ASP.NET MVC / Core and more
As you know, DevExtreme supports multiple web development frameworks. All enhancements described herein are available for: Angular, Vue, React, jQuery, Knockout, ASP.NET MVC and .NET Core.
Watch the Webinar
To learn more about all JavaScript related features introduced in our v19.1 release, please watch our "New in v19.1 - DevExtreme HTML / JS Controls" webinar.
Test It Now (and provide feedback)
Test-drive the public release now. Use the npm package:
npm install --save devextreme@19.1
We’d love to hear from you – please tell us what you think about these enhancements below.
Free DevExpress Products - Get Your Copy Today
 The DevExpress Team