Great UI, Clarity, and Information Relevance

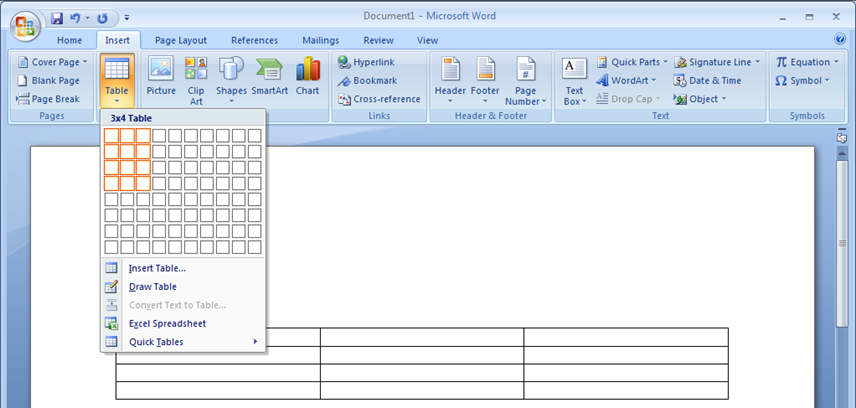
Let's create a 3x4 table in word....
And let's fill the table with data....
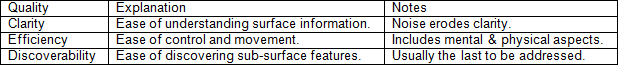
Now, at this point, we might pause to ask "What's wrong?". But before we answer, let's make the observation that in the table above, there are a number of graphic elements working together to convey information. There is the data, rendered as text:
And there are lines separating the data:
Note that in Word, both the lines separating the data, and the data itself, are both rendered with essentially the same visual weight. The thickness of the line matches the thickness of the strokes used to render the text, and the contrast of the lines also matches the contrast of the text.
However, it seems that the lines and the data, in terms of relevance to the viewer, are far from equal. A viewer is far more interested in the data than the lines separating the data.
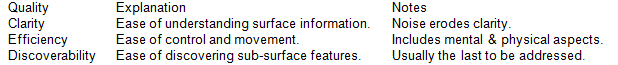
Let's look at the same table in Excel:
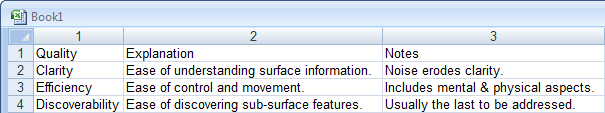
Notice that when creating the same table inside Excel, something interesting has happened. The lines are rendered in a much lower contrast than the data itself.
Which table do you find easier to read?

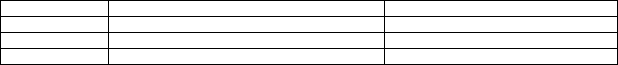
On a whim, let's create a version of this table where we do the opposite of what's done in Excel. Namely, let's reduce the visual weight of the important data, while increasing the visual weight of the much less relevant separating lines:
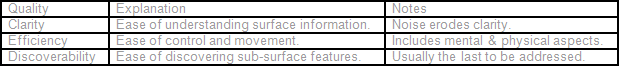
How easy is this to read, compared to the table from Microsoft Excel, above?
So, two important points to take away:
- Not all information is equally relevant to the viewer.
- We have control over the degree to which we can emphasize information.
And from these two realizations, you can reach the third, perhaps most important guideline to achieving clarity in your UI:
Visual weight should match information relevance.
This guideline is incredibly important, easy to follow, and yet violated frequently. My contention, as set forth in the post that explored the question of why great UI was so hard to achieve, is that the rampant violations can be explained by a lack of training.
Here's a screen shot of Visual Basic source code as seen in Visual Studio 2008:
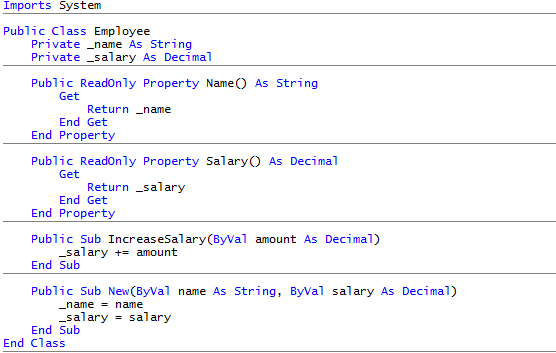
The horizontal lines carry little information relevance. And even though they are rendered above in a medium gray, their contrast and corresponding visual weight far outweigh their intended purpose.
Here's the same image with one minor change:
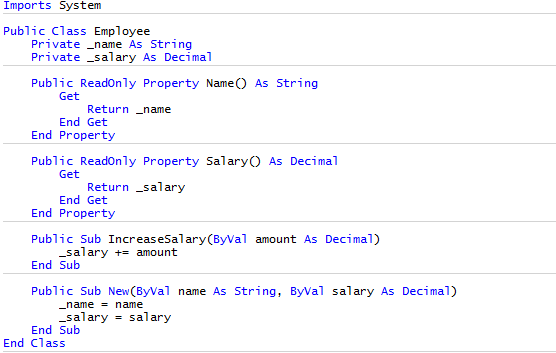
See how much easier it is to get your eyes into the relevant data.
Here's a screen shot from Adobe Lightroom:
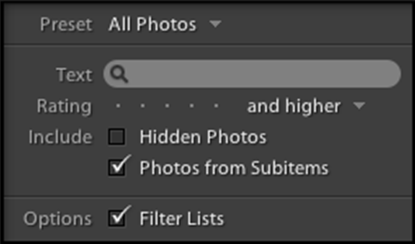
Notice how the labels on the left, being less relevant than the data to their right, are rendered in a lower contrast, allowing your eyes to quickly get to the relevant information.
In near-future posts, we'll talk more about ways to control emphasis and dive deeper into clarity.
Free DevExpress Products - Get Your Copy Today
Mark Miller (DevExpress)