This is the final post in our "Mobile Stock Market App" blog series. If you are new to this series, feel free to review our previous posts to learn more about our Mobile Stock Market app and how it was built using our Xamarin control library.
- Part 1 - Initial design
- Part 2 - Navigation within the app
- Part 3 - Presentation of data collections
In this final post, we’ll show you how we used our Xamarin Forms Charting library to create intuitive stock price analysis views within the mobile app.
NOTE: DevExpress Xamarin.Forms UI controls ship as part of our Universal Subscription.
Portfolio Share Chart
The Stock Market app’s Portfolio Page uses our Xamarin Pie Chart View to display stock allocations within a user’s hypothetical stock portfolio:

View Markup
<dxc:PieChartView
    SelectionMode="Single"
    SelectionBehavior="Hatch">
    <dxc:PieChartView.Hint>
        <dxc:PieHint ShowMode="OnTap"/>
    </dxc:PieChartView.Hint>
    <dxc:PieChartView.Series>
        <dxc:DonutSeries>
            <dxc:DonutSeries.HintOptions>
                <dxc:PieSeriesHintOptions PointTextPattern="{}{L}: {VP}%"/>
            </dxc:DonutSeries.HintOptions>
            <dxc:DonutSeries.Data>
                <dxc:PieSeriesDataAdapter
                    DataSource="{Binding ChartViewModel.Data}"
                    LabelDataMember="Ticker"
                    ValueDataMember="AbsoluteActualValue"/>
            </dxc:DonutSeries.Data>
        </dxc:DonutSeries>
    </dxc:PieChartView.Series>
</dxc:PieChartView>
View Model Code
// This class is used as container for all portfolio charts.
public class PortfolioTabItemViewModel : NotificationObject {
    PortfolioChartViewModel chartViewModel;

    public PortfolioChartType ChartType { get; }
    public PortfolioChartViewModel ChartViewModel {
        get => chartViewModel;
        private set => SetProperty(ref chartViewModel, value);
    }

    public PortfolioTabItemViewModel(PortfolioChartType chartType) {
        ChartType = chartType;
    }

    public void Update(IEnumerable<IrrHistoryItem> irrHistory, IEnumerable<PortfolioItemStatistics> itemStatistics) {
        ChartViewModel = PortfolioChartViewModel.Create(ChartType, irrHistory, itemStatistics);
    }
}

public abstract class PortfolioChartViewModel : NotificationObject {
    public bool ShouldShowDetail { get; }

    public PortfolioChartViewModel(bool shouldShowDetail) {
        ShouldShowDetail = shouldShowDetail;
    }

    public static PortfolioChartViewModel Create(PortfolioChartType chartType, IEnumerable data, bool isDetailedView = false) {
        // Specific View Model initalization is here.
    }
}

public class PortfolioDonutChartViewModel : PortfolioChartViewModel {
    public IEnumerable Data { get; }

    public PortfolioDonutChartViewModel(IEnumerable<PortfolioItemStatistics> data, bool shouldShowDetail) : base(data, shouldShowDetail) {
        Data = data;
    }
}
Model Code
public class PortfolioItemStatistics {
    public string Ticker { get; }
    public double OperationPrice { get; }
    public double ActualPrice { get; }
    public int Count { get; }

    public double OperationValue => OperationPrice * Count;
    public double ActualValue => ActualPrice * Count;
    public double AbsoluteActualValue => Math.Abs(ActualValue);
    public double Profit => ActualPrice - OperationPrice;
    public double ProfitPercent => Profit / OperationPrice;

    public double TotalProfit => Count * Profit;
    public double TotalProfitPercent => TotalProfit / Math.Abs(OperationValue);
    public double AbsoluteProfitPercent => Math.Abs(ProfitPercent);

    // Other properties and methods.

    public PortfolioItemStatistics(string ticker, int count, double operationPrice, double actualPrice) {
        Ticker = ticker;
        Count = count;
        OperationPrice = operationPrice;
        ActualPrice = actualPrice;
    }
}
Profit/Loss Chart
The following chart is also available within the Portfolio Page. It displays Top 10 price movements by absolute value for a given stock:
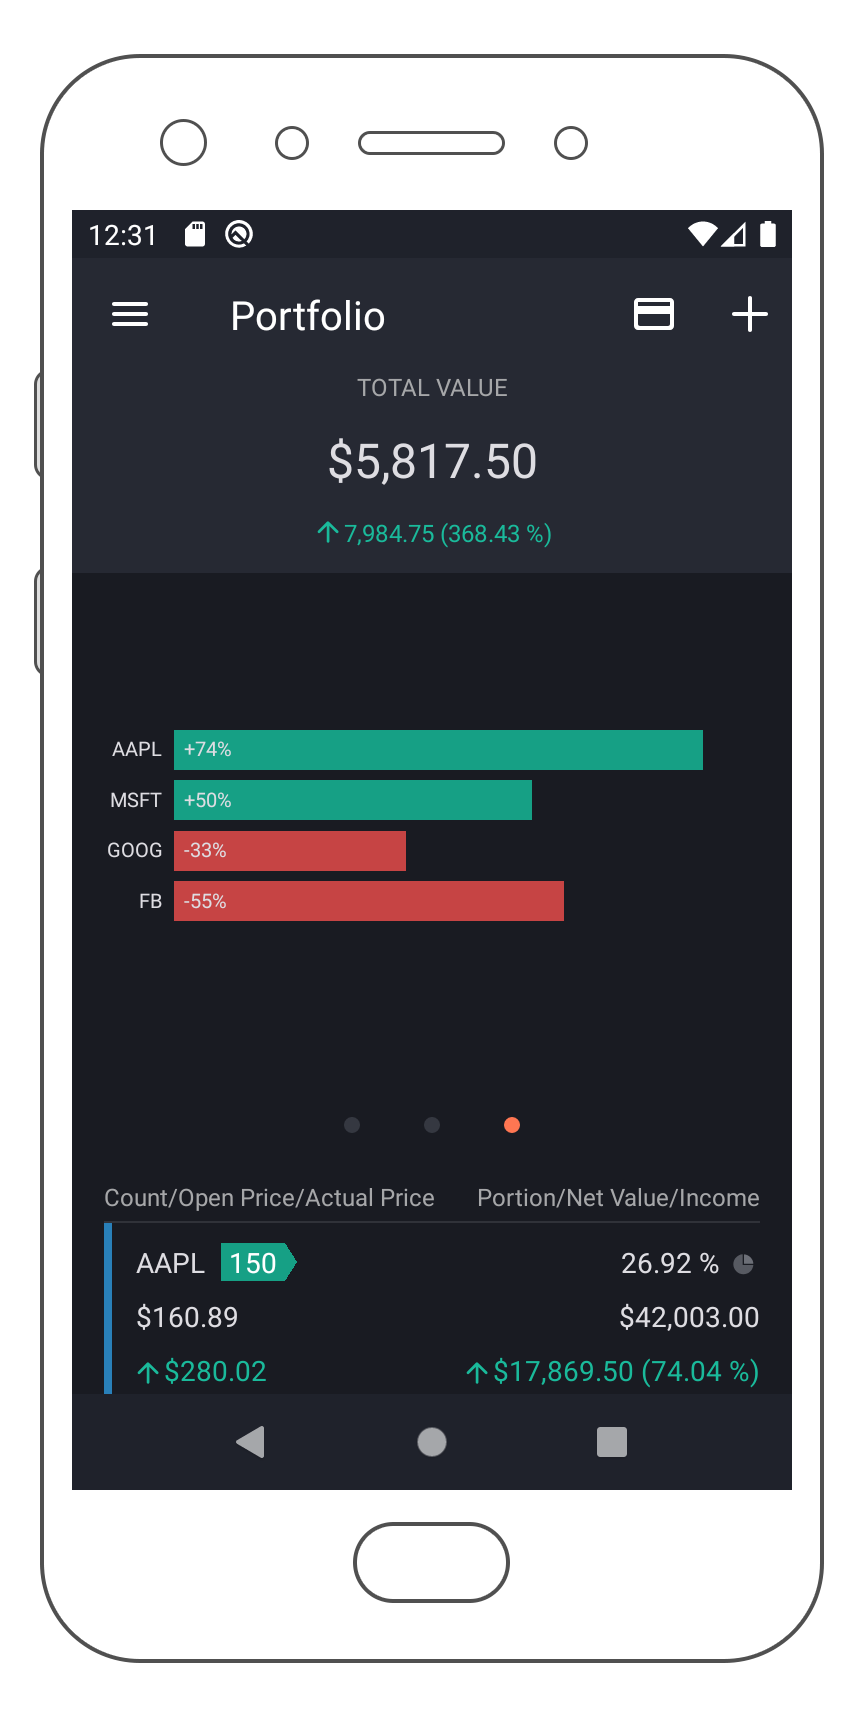
To create this chart, we had to split all values into two groups: gainers and losers. The chart view displays each group using an individual series with assigned colors.
A second interesting implementation within this chart involves bar alignment against the chart’s center. Bars are attached to the chart’s top edge by default. Since we knew the maximum number of bars, we were able to calculate the required side margins to center our bars.
Note: The chart visualizes the same collection of Model objects as the Donut chart - please refer to the previous section for the model class code.
View Markup
<dxc:ChartView Rotated="true">
    <dxc:ChartView.Series>
        <dxc:StackedBarSeries
            BarWidth="{StaticResource BarWidth}"
            Label="{StaticResource PortfolioStackedBarSeriesPositiveValueLabel}">
            <dxc:StackedBarSeries.Data>
                <dxc:SeriesDataAdapter
                    DataSource="{Binding ChartViewModel.Losers}"
                    ArgumentDataMember="Ticker">
                    <dxc:ValueDataMember Type="Value" Member="AbsoluteProfitPercent" />
                </dxc:SeriesDataAdapter>
            </dxc:StackedBarSeries.Data>
        </dxc:StackedBarSeries>
        <dxc:StackedBarSeries
            BarWidth="{StaticResource BarWidth}"
            Label="{StaticResource PortfolioStackedBarSeriesPositiveValueLabel}">
            <dxc:StackedBarSeries.Data>
                <dxc:SeriesDataAdapter
                    DataSource="{Binding ChartViewModel.Gainers}"
                    ArgumentDataMember="Ticker">
                    <dxc:ValueDataMember Type="Value" Member="AbsoluteProfitPercent" />
                </dxc:SeriesDataAdapter>
            </dxc:StackedBarSeries.Data>
        </dxc:StackedBarSeries>
    </dxc:ChartView.Series>
    <dxc:ChartView.AxisX>
        <dxc:QualitativeAxisX>
            <dxc:QualitativeAxisX.Range>
                <dxc:QualitativeRange SideMargin="{Binding ChartViewModel.SideMargin}"/>
            </dxc:QualitativeAxisX.Range>
        </dxc:QualitativeAxisX>
    </dxc:ChartView.AxisX>
    <dxc:ChartView.AxisY>
        <dxc:NumericAxisY Visible="False"/>
    </dxc:ChartView.AxisY>
</dxc:ChartView>
View Model Code
public class PortfolioBarChartViewModel : PortfolioChartViewModel {
    public IEnumerable<PortfolioItemStatistics> Losers { get; }
    public IEnumerable<PortfolioItemStatistics> Gainers { get; }
    public double SideMargin { get; }
    public string VisualMax { get; }
    public string VisualMin { get; }

    PortfolioBarChartViewModel(IEnumerable<PortfolioItemStatistics> losers, IEnumerable<PortfolioItemStatistics> gainers, double sideMargin, string visualMin, string visualMax, bool shouldShowDetail) :
        base(shouldShowDetail) {
        Losers = losers;
        Gainers = gainers;
        SideMargin = sideMargin;
        VisualMin = visualMin;
        VisualMax = visualMax;
    }
}
Question for Xamarin developers: Would you like us to extend the functionality of our Xamarin Chart control so that it paints the values of a single data series using different colors based upon specific logic? Feel free to post your thoughts in the comment section below or email support@devexpress.com.
Historical Price Charts
The following chart displays a ticker price and volume change over time. Users can select a specific time frame (1 minute, 1 hour, etc.) and series type (area or stocks) as desired.
This page utilizes several important chart-related features:
- Multiple axes: Different Y-axes measure the Price and Volume series.
-
Adapting the Y-axis range to actual visible values:
-
Hiding intervals without data on the X-axis:
For example, time intervals between December 17, 5:30 AM and December 18, 11:30 AM are hidden in the animation below.

The following snippet demonstrates how we configured our chart view to display data for this advanced usage scenario:
View Markup
<dxc:ChartView>
    <dxc:ChartView.AxisX>
        <dxc:DateTimeAxisX
            x:Name="axisX"
            EmptyRangesVisible="False">
            <dxc:DateTimeAxisX.Range>
                <dxc:DateTimeRange
                    SideMargin="1"
                    VisualMin="{Binding RangeStart}"
                    VisualMax="{Binding RangeEnd}"/>
            </dxc:DateTimeAxisX.Range>
        </dxc:DateTimeAxisX>
    </dxc:ChartView.AxisX>
    <dxc:ChartView.AxisY>
        <dxc:NumericAxisY
            AlwaysShowZeroLevel="False"
            AutoRangeMode="VisibleValues">
            <dxc:NumericAxisY.Layout>
                <dxc:AxisLayout Anchor1="0.333" Anchor2="1.0" />
            </dxc:NumericAxisY.Layout>
        </dxc:NumericAxisY>
    </dxc:ChartView.AxisY>
    <dxc:ChartView.Series>
        <dxc:CandleStickSeries
            Visible="{Binding IsCloseOnlyShown, Converter={converters:InverseBoolConverter}}">
            <dxc:CandleStickSeries.Data>
                <dxc:SeriesDataAdapter
                    DataSource="{Binding Content}"
                    ArgumentDataMember="Timestamp">
                    <dxc:ValueDataMember Type="Open" Member="Open"/>
                    <dxc:ValueDataMember Type="High" Member="High"/>
                    <dxc:ValueDataMember Type="Low" Member="Low"/>
                    <dxc:ValueDataMember Type="Close" Member="Close"/>
                </dxc:SeriesDataAdapter>
            </dxc:CandleStickSeries.Data>
        </dxc:CandleStickSeries>
        <dxc:AreaSeries
            Visible="{Binding IsCloseOnlyShown}">
            <dxc:AreaSeries.Data>
                <dxc:SeriesDataAdapter
                    DataSource="{Binding Content}"
                    ArgumentDataMember="Timestamp">
                    <dxc:ValueDataMember Type="Value" Member="Close"/>
                </dxc:SeriesDataAdapter>
            </dxc:AreaSeries.Data>
        </dxc:AreaSeries>
        <dxc:BarSeries>
            <dxc:BarSeries.Data>
                <dxc:SeriesDataAdapter
                    DataSource="{Binding Content}"
                    ArgumentDataMember="Timestamp">
                    <dxc:ValueDataMember Type="Value" Member="Volume"/>
                </dxc:SeriesDataAdapter>
            </dxc:BarSeries.Data>
            <dxc:BarSeries.AxisY>
                <dxc:NumericAxisY
                    Position="Far"
                    AutoRangeMode="VisibleValues">
                    <dxc:NumericAxisY.Layout>
                        <dxc:AxisLayout Anchor1="0.0" Anchor2="0.333" />
                    </dxc:NumericAxisY.Layout>
                </dxc:NumericAxisY>
            </dxc:BarSeries.AxisY>
        </dxc:BarSeries>
    </dxc:ChartView.Series>
</dxc:ChartView>
View Model Code
public abstract class InitializableViewModel<TContent> : BaseViewModel, IInitializableViewModel, IErrorHandler {
    public TContent Content {
        get => content;
        private set => SetProperty(ref content, value, onChanged: OnContentChanged);
    }
    //Other properties are here.

    public InitializableViewModel() : this(InitializableViewModelState.Loading) {
    }

    public InitializableViewModel(InitializableViewModelState initState) {
        State = initState;
    }

    // Lifecycle methods that call 'SendRequestAsync' are here.

    protected abstract Task<TContent> SendRequestAsync(CancellationToken token);
}

public class SymbolHistoricalPricesViewModel : InitializableViewModel<IList<HistoricalPrice>> {
    // Inner field declaration is here.

    public bool IsCloseOnlyShown {
        get => isCloseOnlyShown;
        set => SetProperty(ref isCloseOnlyShown, value);
    }
    public TimeFrame TimeFrame {
        get => timeFrame;
        private set => SetProperty(ref timeFrame, value, onChanged: (_, v) => {
            localStorage.TimeFrame = TimeFrame;
        });
    }
    public DateTime RangeStart {
        get => rangeStart;
        private set => SetProperty(ref rangeStart, value);
    }
    public DateTime RangeEnd {
        get => rangeEnd;
        private set => SetProperty(ref rangeEnd, value);
    }

    public SymbolHistoricalPricesViewModel(ILocalStorage localStorage, string ticker, IHistoricalPriceRepository historicalPriceRepository) : base() {
        // Inner fields initialization.
    }

    protected override Task<IList<HistoricalPrice>> SendRequestAsync(CancellationToken token) {
        return historicalPriceRepository.GetHistoricalPrice(ticker, TimeFrame, token);
    }
}
Application Source Code
Once again, this is the final post in our series. You can review/download the complete source code for this app using the following link: Stock Market App.
Your Feedback Matters
As always, if you’ve yet to try our Xamarin.Forms UI controls or would like to discuss your business needs further, please comment below or write to us at info@devexpress.com.
Free DevExpress Products - Get Your Copy Today
The following free DevExpress product offers remain available. Should you have any questions about the free offers below, please submit a ticket via the
DevExpress Support Center at your convenience. We'll be happy to follow-up.