In this tips & tricks post, we’ll discuss a couple of recent enhancements and share links to a few interesting technical support tickets. We hope the information in this post will be of value to those of you using DevExpress Reports. Should you have any suggestions for future tips & tricks post, please leave a comment below.
Our Most Recent Enhancements
The following is a list of our most recent enhancements. If you'd like more information about the features/capabilities listed below, please submit a comment or post a support ticket via the DevExpress Support Center.
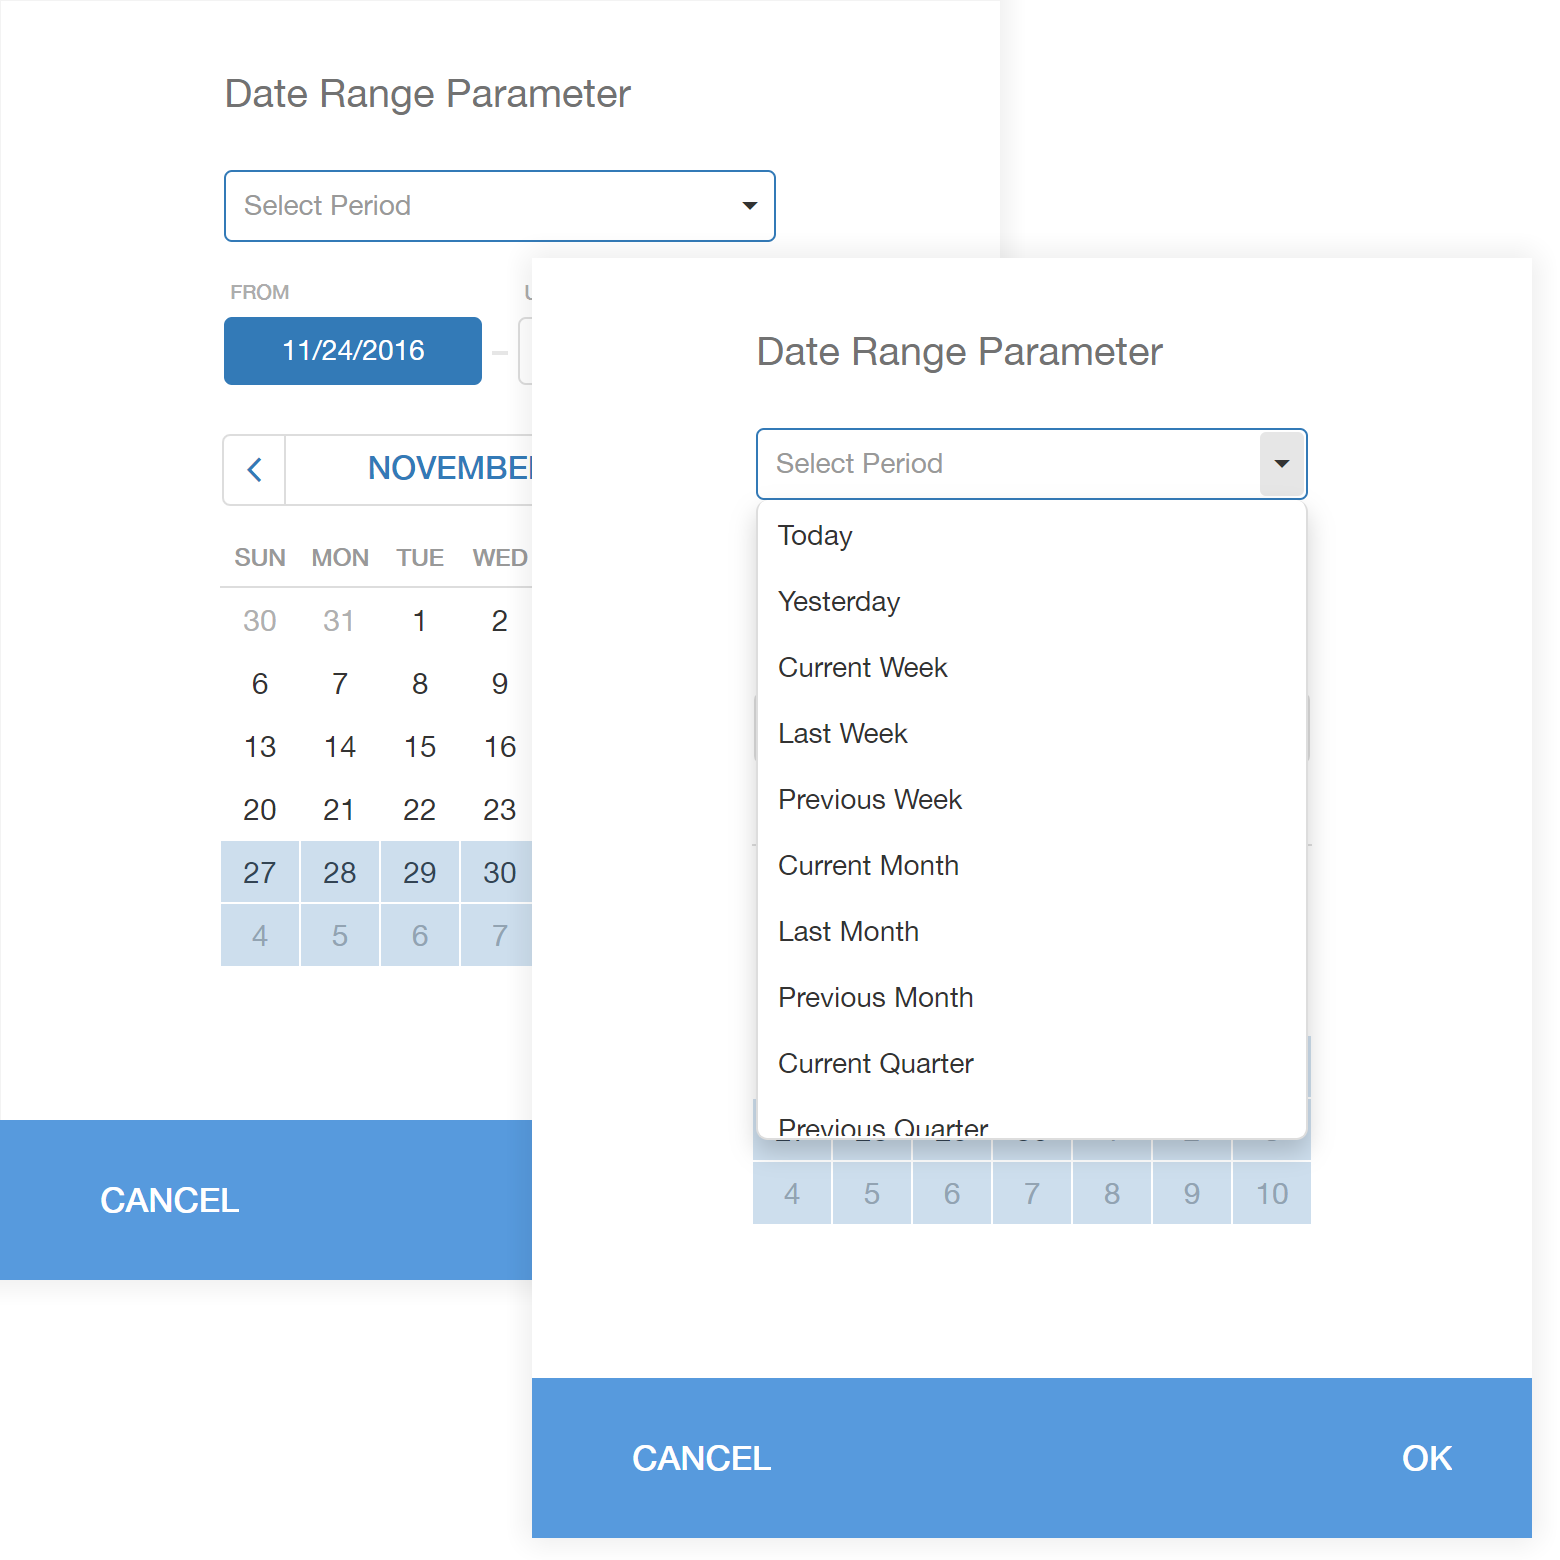
Date Range Parameter Editor
As you probably know, we introduced Date Range Parameter support in our last release cycle. If you’ve yet to use this feature, please take a moment to review its capabilities and share your thoughts with us. We’d love to know what you think of our Mobile Mode implementation (Web Document Viewer).
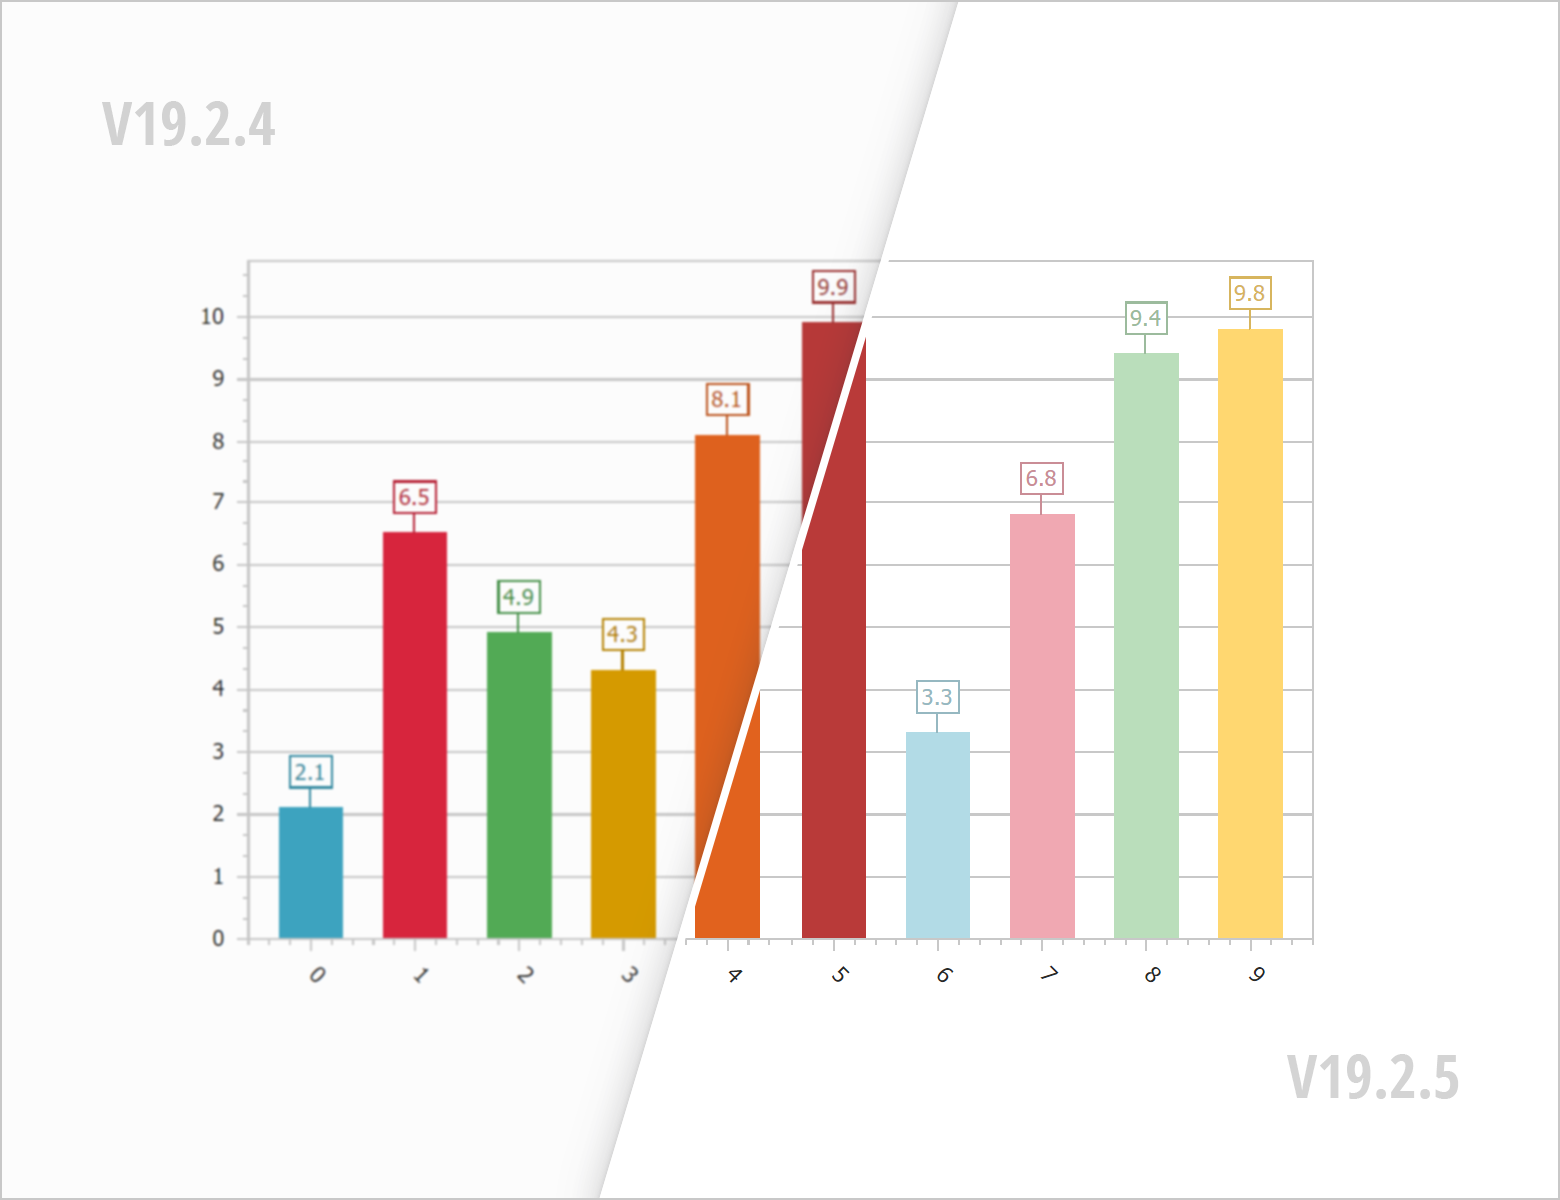
Web Report Designer – Chart Cleaner Appearance
Our updated Web Report Designer (v19.2.5) uses SVG rendering to display charts. As you can see from the image below, rendering is now “cleaner.”
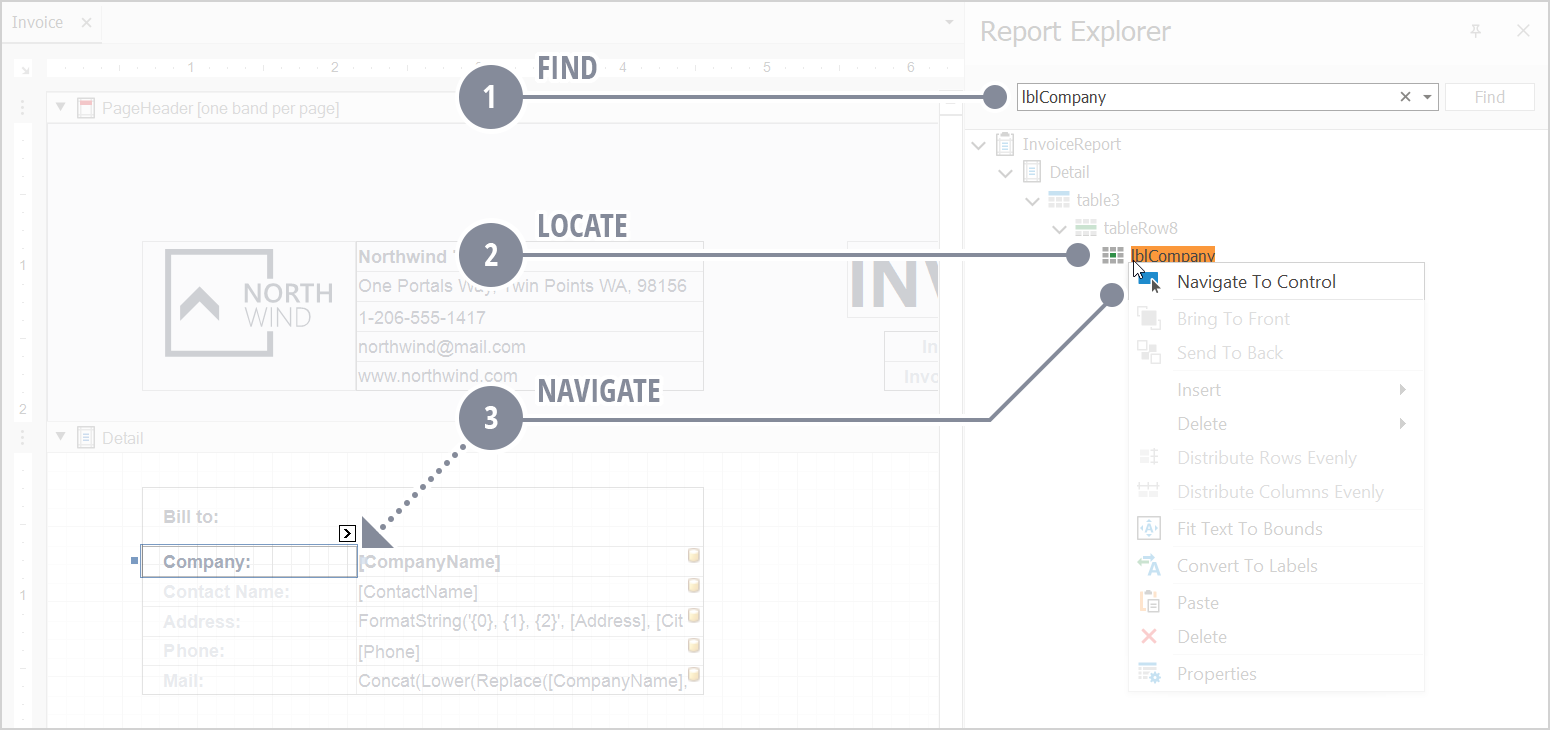
Report Designer – Easier Navigation
Have you ever wanted to customize a particular control, but were unable to do so because of report layout size and complexity? If so, you’ll be happy to know that our report desktop designer in v19.2.6 ships with a new “Navigate To Control” option – making navigation to a target component extremely easy (scrolling / expansion will be performed automatically).
Report Designer – Easier Alignment
Creating a perfect Excel file requires one to invest time in control alignment. We’ve already detailed some of the issues you may encounter in the following blog post: Troubleshooting Excel and CSV Export. With our next minor update (v19.2.6), you will be able to convert standalone report labels into a table (making alignment much easier).
Report Designer – Expand / Collapse All Bands
Here's yet another enhancement to our desktop End-User Report Designer components (v19.2.6). You can now quickly expand and collapse all report bands via context menu commands:
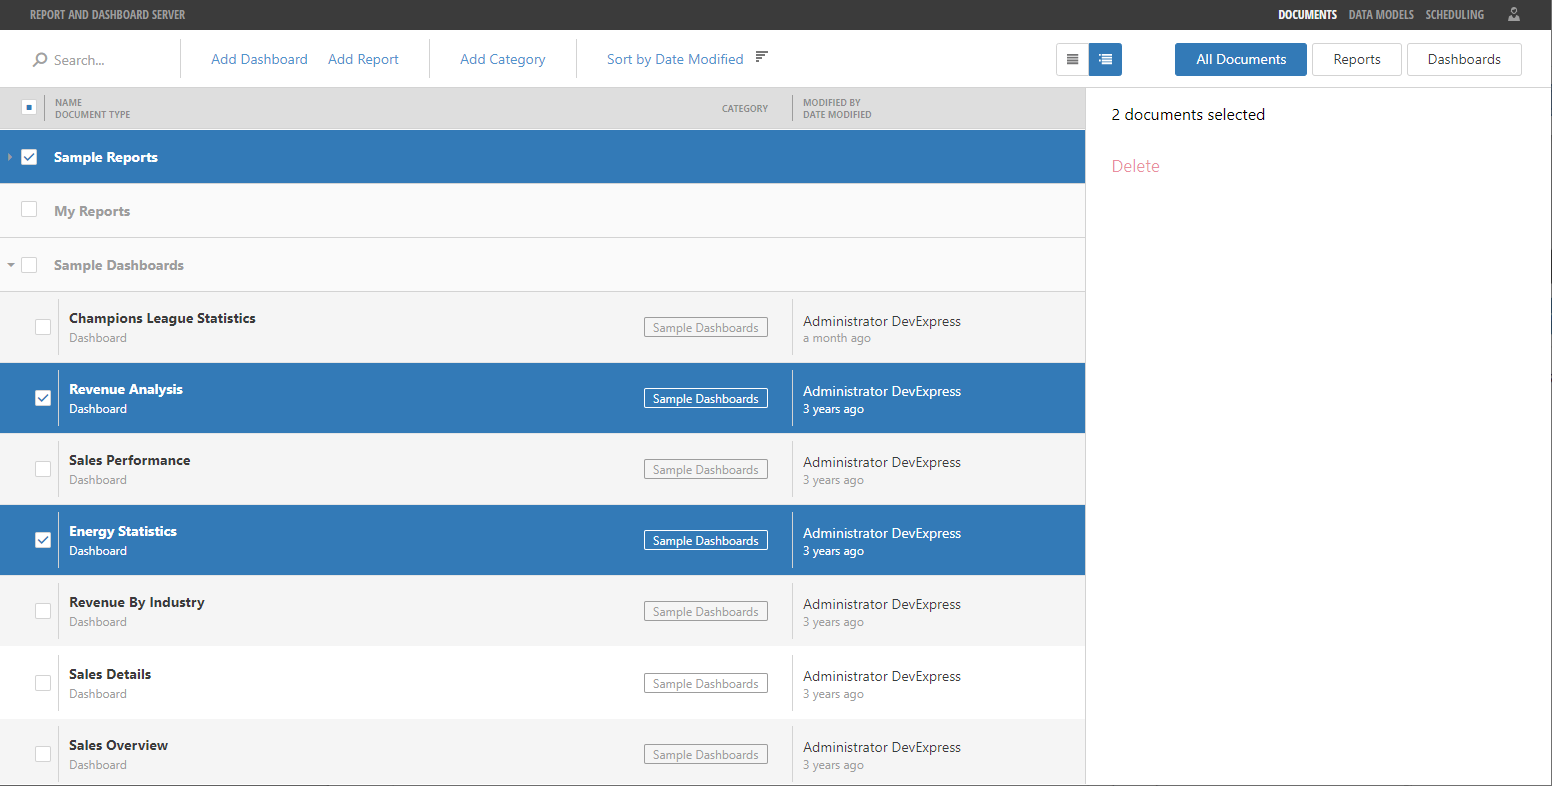
Document Management in Report & Dashboard Server
DevExpress Report & Dashboard Server now ships with a Documents Categories view (v19.2.5). This view allows you to group documents and process them in a batch:
Interesting Technical Support Tickets
Reporting – Moving from XRPivotGrid to XRCrossTab
WPF Reporting
Web Reporting
Report & Dashboard Server
Documentation Updates
New Topics
Updated Topics
Various End-User Documentation Updates
As you may know, we include end-user documentation for our Report Designer and Document Viewer controls. You can access this documentation on GitHub.
As always, we welcome your comments and feedback. If you’ve come across a useful Support Center ticket, feel free to share it with the DevExpress developer community here.
Free DevExpress Products - Get Your Copy Today
The following free DevExpress product offers remain available. Should you have any questions about the free offers below, please submit a ticket via the
DevExpress Support Center at your convenience. We'll be happy to follow-up.