Reporting — Conditional Cell Visibility, New Summaries, and HTML-Inspired Text Formatting for Cross-Tab (v22.1)

As you may know, our Cross Tab Report control was first introduced in October 2019. The Cross Tab Report control was designed to address limitations in our Pivot Grid control and to enhance overall cross-tab reporting capabilities with DevExpress Reports.
From the beginning, the Cross Tab Report control could create cross tab reports in a few easy steps via our integrated wizard, edit cross tab elements directly within the DevExpress Report Designer, customize cell contents with expressions, and much more…
To help address key usage scenarios (based on customer feedback), our most recent major release (v22.1) ships with a number of enhancements — features designed to augment the capabilities of the DevExpress Cross Tab Report control.
Hide Cells by Condition
Cross Tab Cells now support expression bindings for the XRCrossTabCell.ColumnVisible and XRCrossTabCell.RowVisible properties. The properties are bindable for all cross tab field areas: rows, columns, and data cells. You can hide rows, columns, and totals based on a condition, all without a single line of code.
Example 1: Hide a column based on another column value
In this example, we will hide the Count column if the Required column value is False. The initial cross tab is pictured below:


To hide the Count column when the Required column value is False, select the row total cell for the Count column, click the f button to activate the Expression Editor, and specify the following expression for the ColumnVisible property:
[Required] == TrueWith this modification, the report will be rendered as follows:

Example 2: Hide a row when a column value is empty
The Cross Tab control displays empty cells in the following cases:
-
The data source contains no records for a column.
-
The data source contains NULL values for a column.
Our goal is to hide the cross tab rows if the Required cell in this row is empty. To achieve this, we must specify the following expression for the RowVisible property of the Required Column Grand Total cell:
[Required] > 0With this modification, the report will be rendered as follows:

Html-Inspired Text Formatting
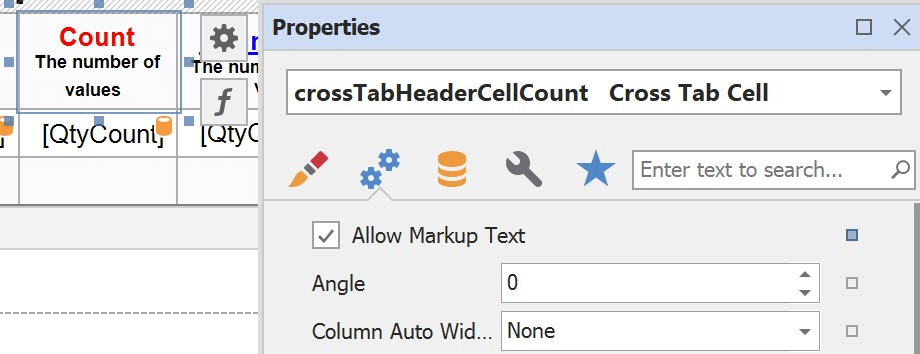
In v22.1, Cross Tab cells include a XRCrossTabCell.AllowMarkupText property. Once enabled, this property allows you to use HTML-inspired tags to format data displayed within cells.
The following formatted string aligns the text to the center of the header cell, applies the Red color to the first line, and appends a new line with a smaller font:
<p align="center"><color=red>Count</color><br><size=-3>The number of values</size></p>Here’s the result:

You can use HTML-inspired tags in a cell Text expression. For example, the following expression highlights the count in Yellow when the value is greater than 5.
IIF([QtyCount] > 5, '<backcolor=yellow>' + [QtyCount] + '</backcolor>', [QtyCount]) 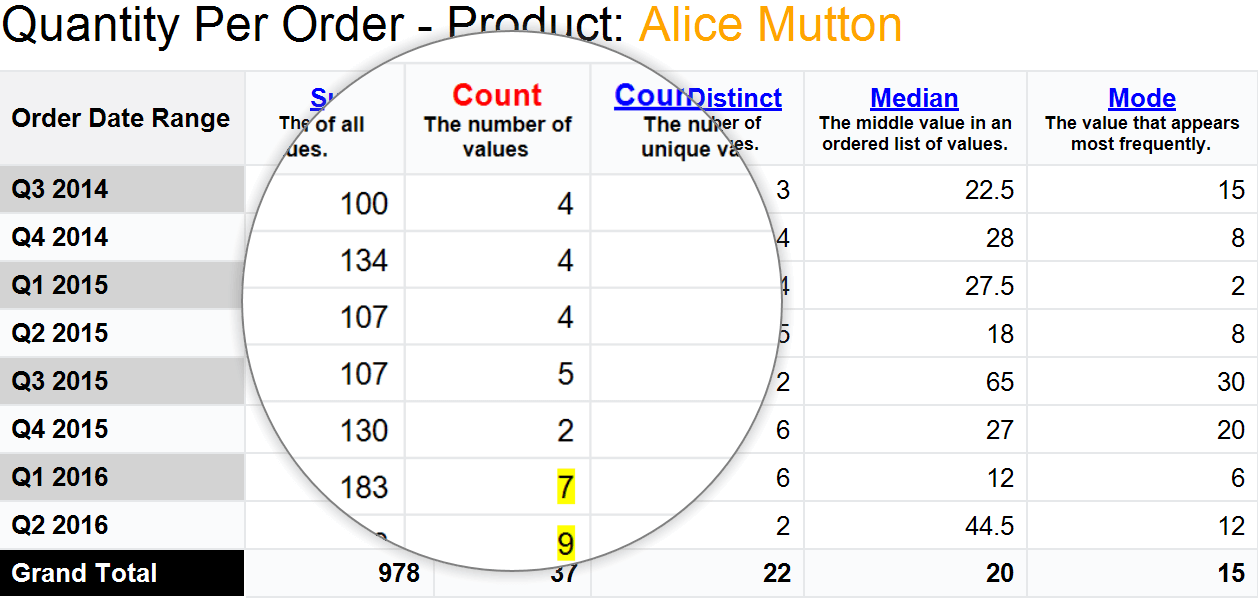
To display images, add images to the XtraReport.ImageResources collection. Specify an expression for a cell Text property and assign the ImageItem.Id to the Image tag:
IIF([QtyCount]>[QtyCountDistinct],[QtyCountDistinct] + '<image=downarrow;size=16,16>', [QtyCountDistinct])
Optimized Calculation Engine and New Summary Functions
With this release, the Cross Tab control runs a more optimized calculation engine inherited from the WinForms PivotGrid control.
Migration to the optimized calculation engine allowed us to extend the control's summary function set. CountDistinct, Median, and Mode summary functions are now available. The following report displays a Cross Tab control which calculates various summaries and a tabular report which displays the same data grouped by Year.

If you'd like to learn more about these new features, please refer to the following sample project: Reporting - CrossTab Control Customization.
Your Feedback Matters
Please take a moment to answer the following question. Your vote will help us fine tune our Cross Tab-related development plans.
Free DevExpress Products - Get Your Copy Today
 Dmitry Tokmachev (DevExpress)