We've got the following changes on tap for XtraCharts v2008 vol 2...
Group Summary Calculations
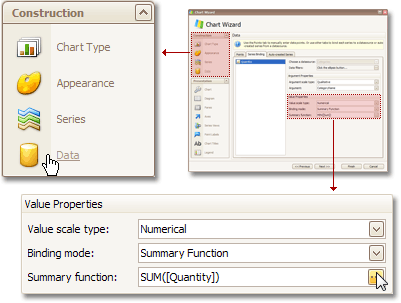
There are numerous instances where analysis of every single record in your dataset is unnecessary - it's enough to see aggregated numbers (i.e. instead of viewing each sale you only need to compare how many BMWs were sold compared to Mercedes-Benz). Such data analysis is the primary purpose of our XtraPivotGrid control and can also be performed via the Group Summary feature in the XtraGrid Suite.
Previously, this kind of data analysis was available in XtraCharts only when used in combination with our PivotGrid control. This combination is no longer required since our chart control now fully supports aggregate function calculation against data groups. Traditionally, there are five built-in functions – sum, maximum, minimum, count and average. You can also implement custom aggregate functions by registering your own calculation procedure. As a result, your custom function will be available to end-users via the XtraCharts Wizard.
Top N Values Display
In a continued effort to deliver more flexible data analysis options, here's one more feature that made it from the XtraPivotGrid to XtraCharts. This feature offers you the option to display only a few of the most important values (such as sales for a few best-selling car models). Simply specify the number of best values you're interested in and XtraCharts will automatically filter out the rest.
This feature also allows you to enable the remaining values (Others) – an aggregate value calculated against all records that were filtered out.
Smart Positioning for Value Labels
Although charts display axes with tickmarks and can even display a grid within the diagram, it may be difficult for end-users to determine exact values or to compare them. In these instances, the best way to improve chart readability is to enable value labels. This solution has always had a disadvantage – if values were too close to one another, their labels could overlap.
In version 2008 vol 2, XtraCharts introduces a new label arrangement mechanism. When enabled, value label position is calculated taking into account neighboring labels and thus making certain that labels won't overlap one another.
This works in all chart types with the following two temporary exceptions.
- Labels in Pie and Donut views can't use this mechanism if they are displayed within the pie (donut) area.
- This label arrangement style does not work with the Medium Trust permission level.
Trend Lines
XtraCharts v2008 vol 2 introduces a chart element that was missing from our views – Trend Lines. These lines connect a value (Open, Close, Low or High in Financial charts) of one argument with a value of another argument. You can also force a trend line to be extrapolated.
As with many other elements in XtraCharts, Trend Lines can be hot-tracked and selected by end-users. Thus, you can allow end-users to delete or customize specific trend lines, as shown in our product demo.
Multi-Pane Charts
If you must display several series that share the same arguments or the same values, a few options are available to you:
- Display several charts
This will require a lot of form space and this approach has no benefit of sharing argument axis.
- Display several series in one diagram
This works fine if series can share both axes. If not, you will end up creating secondary axes, which make a chart unreadable if you have more than two series.
- Display a multi-pane chart (new option available with XtraCharts Suite v2008 vol 2)
This chart type has multiple side-by-side charts that can share an axis - you can even enable simultaneous diagram scrolling.
Free Formatting in Chart Titles
Chart titles have improved with v2008 vol 2. You can now use HTML-like markup to format text fragments.
Miscellaneous Enhancements
- A new page has been added to the XtraCharts Wizard. This page allows you or end-users to customize the chart control's background, including background image, fill style and border settings.
- Radial and tangent label orientation styles have been implemented in Pie and Donut Views.
- In ASP.NET applications, you can now print and export charts using client-side methods (that generate appropriate callbacks).
- You have more control over grid lines when using date-time arguments. Previously, the first grid line was drawn at the first argument and then was repeated, say, each day. As a result, grid lines hardly helped with data analysis, since they were all displayed at some inappropriate time. With this release, you can avoid this by enabling a single option. As a result, grid lines will ignore chart values and will be displayed at the beginning of each day, hour, etc.
- New measurement units can now be used in date-time scales - milliseconds, weeks and quarters.
Free DevExpress Products - Get Your Copy Today
The following free DevExpress product offers remain available. Should you have any questions about the free offers below, please submit a ticket via the
DevExpress Support Center at your convenience. We'll be happy to follow-up.