Charts and Maps (WinForms and WPF) - Runtime Customization Tools

To help us draft our 2020 Desktop Roadmap, we need your feedback. Please take a moment to review the runtime customization tools we currently ship in our WinForms Charts and Map and WPF Chart and Map libraries and tell us more about your runtime customization requirements below.

Chart Designer and Toolbar

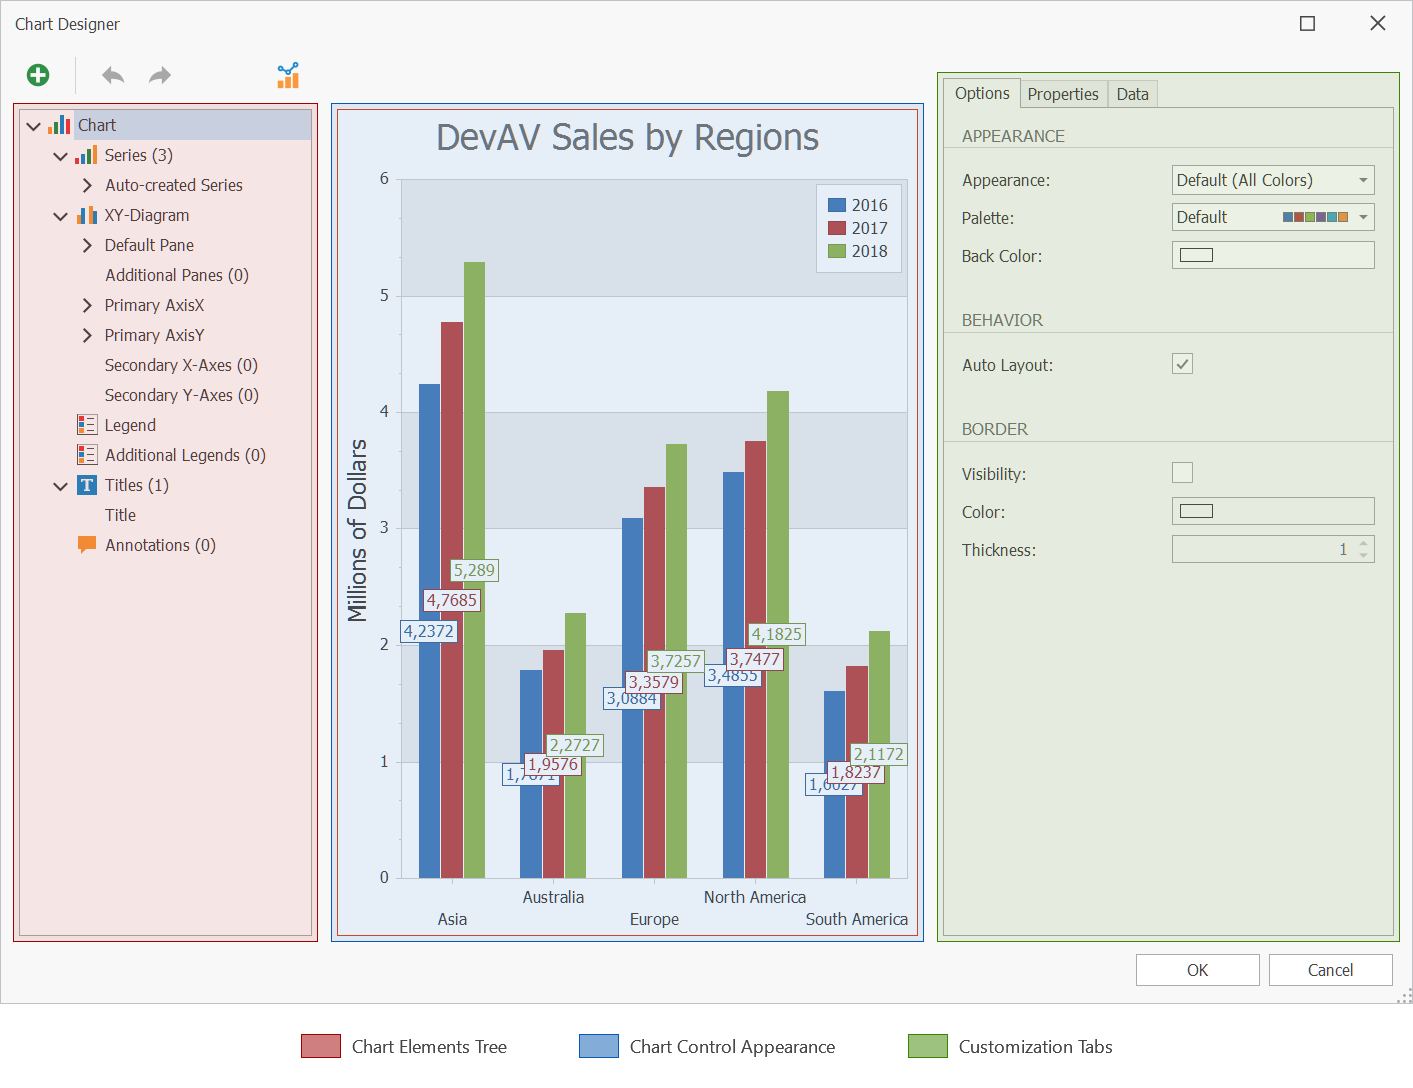
Our Chart Designer (available for WinForms and WPF) gives end users access to the chart’s entire layout hierarchy and can therefore modify existing chart layouts by adding new elements or by creating a new chart layout from scratch.

This approach is beneficial to both app developers and to end-users as there is no need to deploy a large set of predefined chart layouts to address all possible usage scenarios. With it, you can allow users to modify chart layouts based on requirements (you can also save the modified template for future use, when necessary).

The Chart Designer’s layout is split into three primary sections - Chart Elements Tree, Chart Control Appearance (Preview) and Customization Tabs. We implemented this UI to simplify usage and avoid use of multiple pages and nested tabs.

Note: You can explore the capabilities of our Chart Designer using the following links:

WinForms DemoWPF Demo.

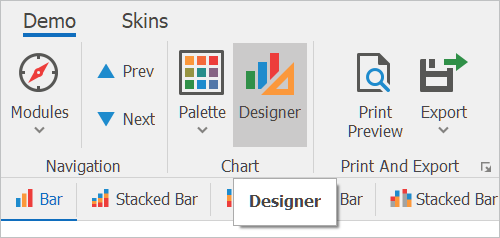
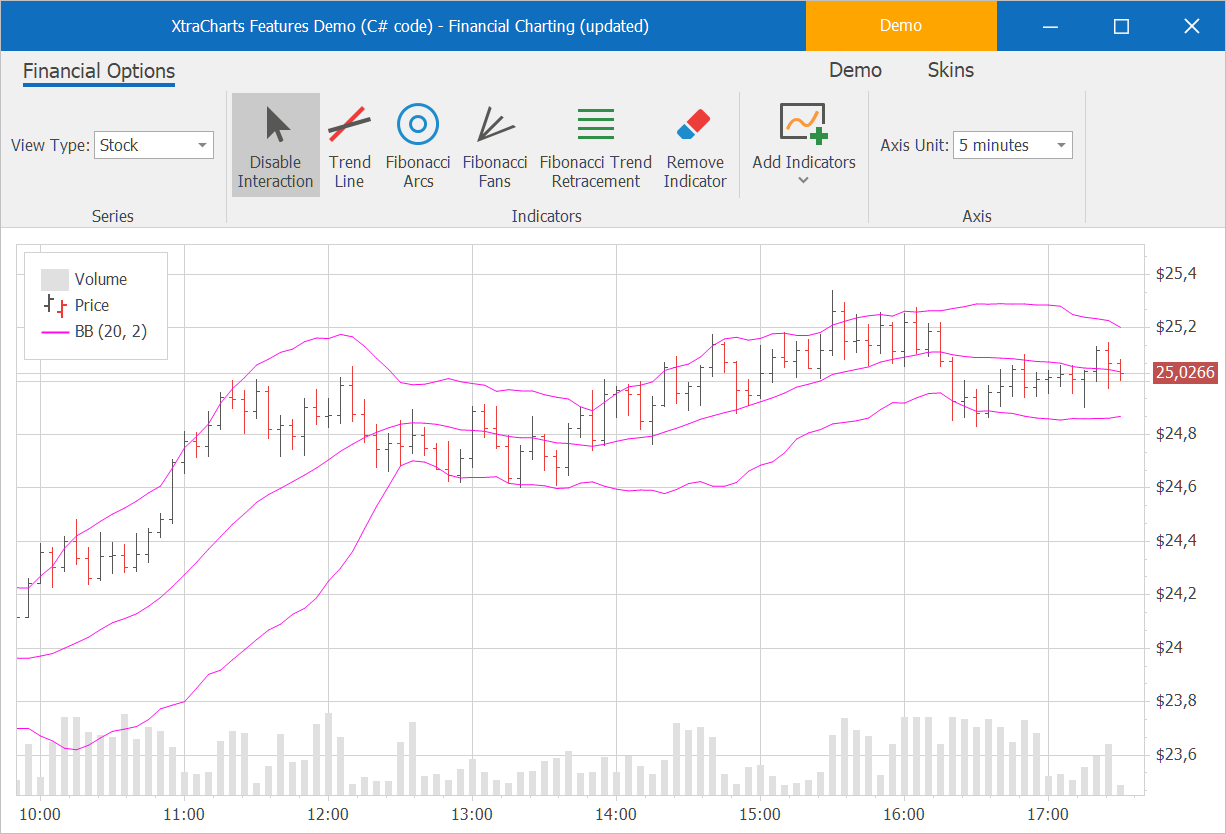
In our most recent update (v19.2), we also extended our Chart Toolbar (see Chart Ribbon and Toolbars). This feature is helpful for quick layout customization or when you don’t require a full-featured designer.

Try it yourself: WinForms Demo.

Map Editor

With our built-in vector editor (available for WinForms and WPF), you can modify input vector data at runtime. You can also use the MapControl API to save modified vector data to any supported format (Shapefile, KML, SVG, WKT).

We developed this feature to address two issues:

1) To avoid use of third-party tools for  vector data editing.

2) Simplify the development process for those building their own editor from scratch.

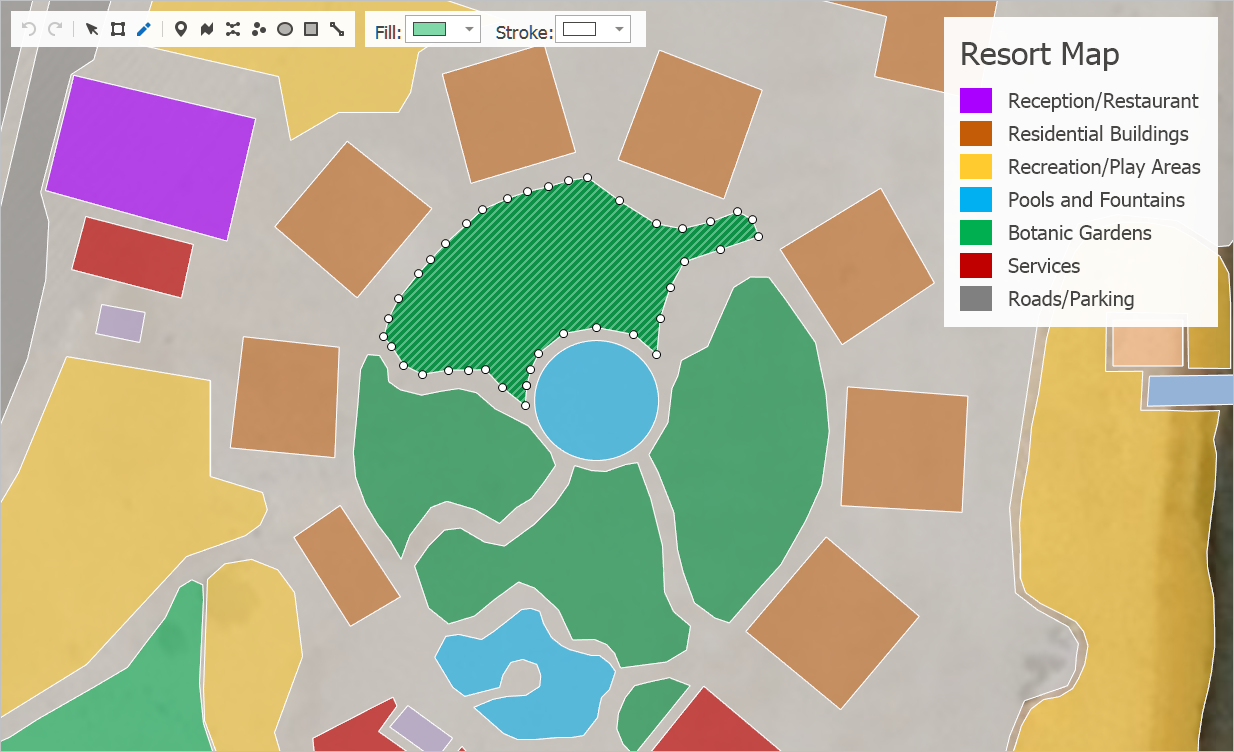
Note: Our Map Editor works in both Geographic and Cartesian coordinate systems. The control can be used to solve cartographic and general vector editing tasks (such as creating room plans). This feature and the MapControl API was developed based on actual usage scenarios (see the following post for additional information).

Try it yourself:

WinForms DemoWPF Demo.

Future Enhancements - Your Feedback Counts

To help us prioritize development efforts in 2020, please complete the following survey:

Free DevExpress Products – Get Your Copy Today

The following free DevExpress product offers remain available. Should you have any questions about the free offers below, please submit a ticket via the DevExpress Support Center at your convenience. We’ll be happy to follow-up.
Customer109860
Customer109860
Hi all, I'm starting to work in a GIS editor winform and I want to know if devexpress have geotools like merge shapes, split by line, and the ability to load and save changes in a database. Thank you
18 November 2019
Rick Mathers
Rick Mathers

Shape Attributes is a big one for me.  I primarily using QGIS to build accommodation maps for a reservation system, and one of the key elements is being able to use the attributes to assign the actual accommodation numbers and display numbers to a specific point.

One additional requirement I would have is the ability to drop POIs (with a corresponding image like "Restroom", "Gym", etc.). 

I have not used the DevExpress Editor or Map display so I don't know fully what it does.  We are however; wanting to give a lot of the development power to our end-users so this makes for an interesting tool.  


18 November 2019
Customer56436436
Rustamer
It would be very nice if Map Control supported the most popular GPX format. In fact, all Cycling programs and navigators on phones use it when building routes.
18 November 2019
Alex (DevExpress Support)
Alex (DevExpress)

@Customer109860,

As I mentioned in our recent conversation, Map Editor does not support this functionality (all currently supported edit modes are described in the Map Editor article). As for load/save methods, they are available for the following formats: SHP, KML, SVG and WKT. 


@Rick Mathers,

From what I gather, you are referring to the scenario when an end-user creates or modifies different types of map pushpins. We will take this functionality into account.


@Customer56436436,

Thanks for your awesome feedback. We expect to introduce this capability in our v20.1 dev cycle. 

20 November 2019
hucker
hucker

I would like to see custom chart aggregation to enable  median and standard deviation as well as weighted averaging.

I think your chart control data designer should have a "weight" drop zone to allow a weighted average aggregation.  The example of this would be if you had data by year of Semester/Grade/Credits and wanted to draw a line showing grade point average by semester you  could average the Grade and apply Credits column as the weight to calculate the GPA for the semester.  I would use this ALL the time by having a cumsum checkbox that just enabled the plot.

I would really like a cummulative sum plot.  This could be done like your histogram X axis aggregation (which effectively is a Count aggregation) but would be the Sum(ish) aggregation.  

22 November 2019

Please login or register to post comments.