DevExpress Dashboard - Early Access Preview (v20.1)

Our next major update (v20.1) is a couple of months away. As such, we wanted to preview the features we expect to ship this Spring and invite all active DevExpress Universal subscribers to download our Early Access Preview (EAP). Your feedback will help us refine the features described below and allow us to ship the best possible royalty-free BI Dashboard platform in the marketplace.
Early Access and CTP builds are provided solely for early testing purposes and are not ready for production use. This build can be installed side by side with other major versions of DevExpress products. Please backup your project and other important data before installing Early Access and CTP builds.
This EAP may not include all features/products we expect to ship in our v20.1 release cycle. As its name implies, the EAP offers an early preview of what we expect to ship in two months.
Active Universal Subscribers: Download the EAP Today
Extending DevExpress Dashboard's Lifecycle API
Earlier this year, we published our 2020 Roadmap and detailed our primary objective: To evolve DevExpress Dashboard and give you (and your end-users) the ability to effectively customize the Dashboard throughout its entire lifecycle.
Our Early Access Preview includes the following lifecycle-related API enhancements:
- Web Dashboard – Custom Properties for Dashboard Item, Custom Properties for Dashboard Data Item Containers (Chart Series, Grid Columns, Cards, Maps), Custom Properties For Dashboard
- Web Dashboard – Options Panel customization (based on DevExtreme Form API)
- Web Dashboard – event subscription with multiple handlers
- Web Dashboard – new event itemWidgetOptionsPrepared (which can be used as a replacement for a pair of events itemWidgetCreated / itemWidgetCreated)
- Web Dashboard – extended context for the existing events
- .NET Dashboard Model – Custom Properties for Dashboard Items, Custom Properties for Dashboard Data Item Containers and Custom Properties for Dashboard
- WinForms – simplified Ribbon Menu Customization based on Selected Dashboard Item Type (DashboardBarItemCategory and more).
- WinForms Dashboard Designer – new events (DashboardOptionsChanged, DashboardCustomPropertyChanged, DashboardItemSelected)
- WinForms Dashboard Designer & Viewer - extended context for event handlers. Extended context includes the Model of processed Dashboard Items (with Custom Properties)
- WPF Dashboard Viewer - extended context for event handlers
- Export Customization API.
Sample
I'll now demonstrate the value of our new API and illustrate how you can extend existing designer functionality with ease.
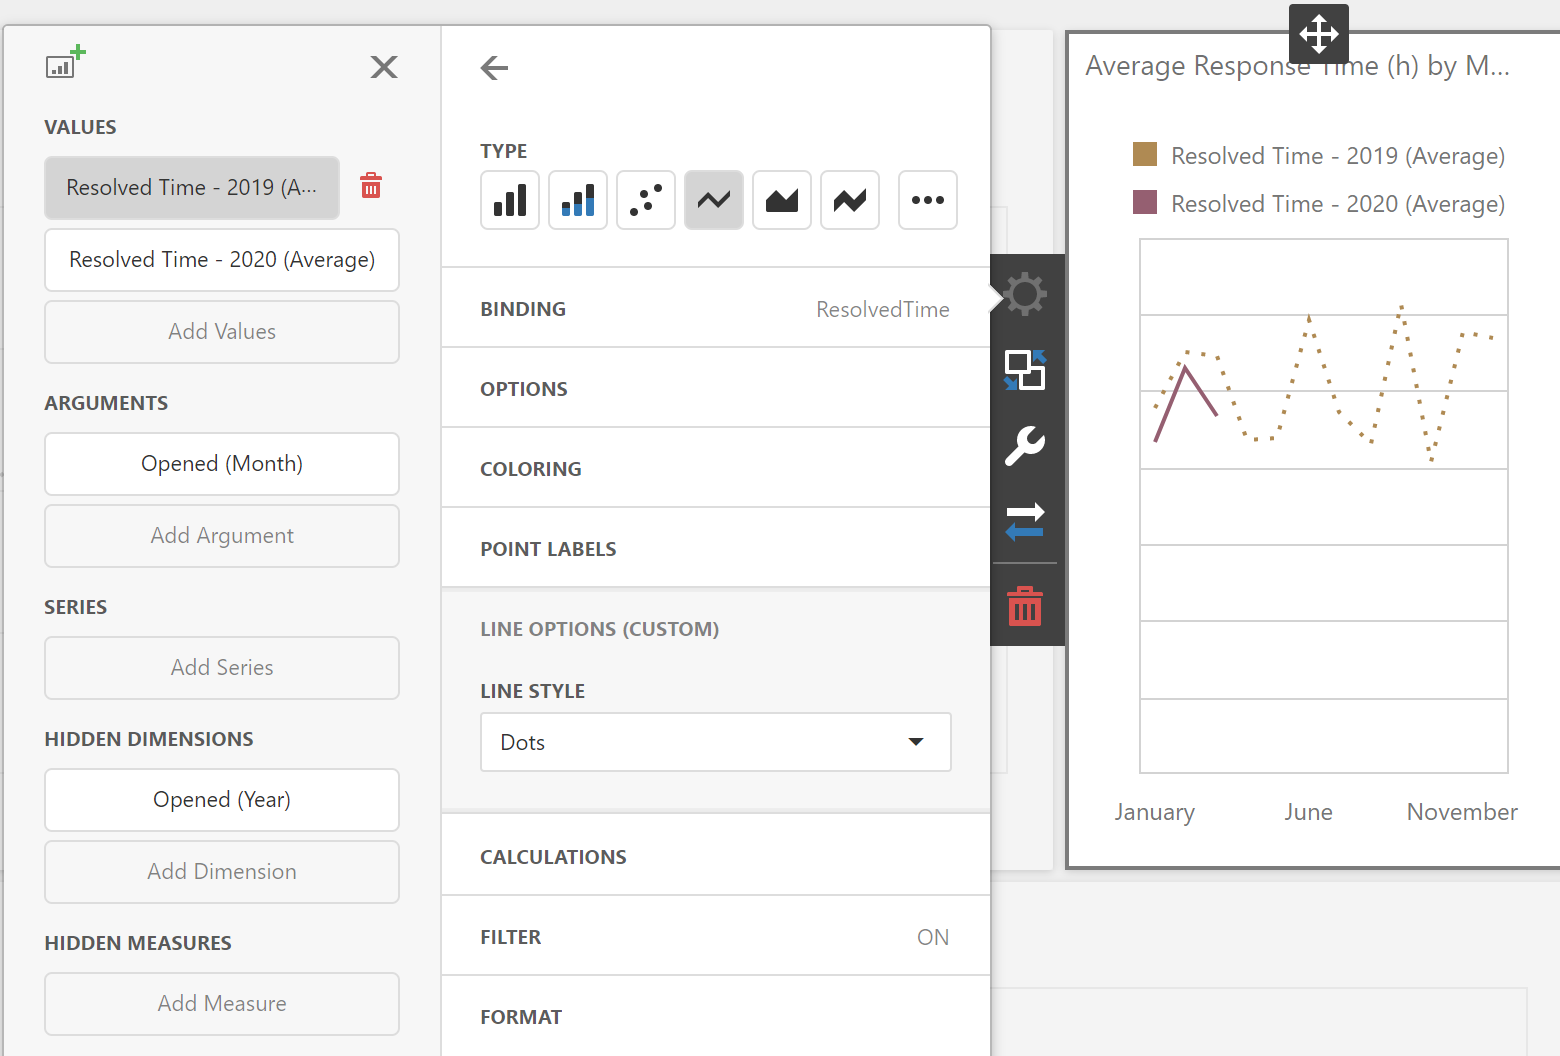
Let's assume you want to allow your end users to configure our Dashboard Chart Item. The goal is to change the drawing style used for the Chart's Line Series.
To begin, you'll need to set up your Web Dashboard Control. You'll need to declare and register the metadata for your custom property – the property that will store a user's selection in a custom LineTypeProperty XML element.
const lineTypeProperty = {
    ownerType: Model.SimpleSeries,
    propertyName: "LineTypeProperty",
    defaultValue: "solid",
    valueType: "string"
};

Model.registerCustomProperty(lineTypeProperty);
Next, you'll set up the Editors that are going to be displayed to end users:
_onCustomizeSections = function(args) {
…
    args.addSection({
        title: "Line Options (Custom)",
        items: [
            {
                dataField: lineTypeProperty.propertyName,
                editorType: "dxSelectBox",
                label: {
                    text: "Line style"
                },
                editorOptions: {
                    items: [
                        { value: "dash", displayValue: "Dashes" },
                        { value: "dot", displayValue: "Dots" },
                        { value: "longDash", displayValue: "Long Dashes" },
                        { value: "solid", displayValue: "Solid Line" },
                        { value: "dashdot", displayValue: "Dash-Dot" }
                    ]
…
                }
            }
        ]
});
You then subscribe to the new itemWidgetOptionsPrepared event to customize the widget based on user selection.
viewerApiExtension.on("itemWidgetOptionsPrepared", _onItemWidgetOptionsPrepared);
…
_onItemWidgetOptionsPrepared = function(args) {
    if (args.dashboardItem instanceof Model.ChartItem) {
        var seriesOptionArray = args.options["series"] || [];
        seriesOptionArray.forEach(function(seriesOption) {
            if (seriesOption.type === "line") {
                var series = args.chartContext.getDashboardChartSeries(seriesOption);
                if (series) {
                    var lineType = series.customProperties.getValue(lineTypeProperty.propertyName);
                    seriesOption.dashStyle = lineType;
                }
            }
        });
    }
};
That's all you'll need for the Web portion....
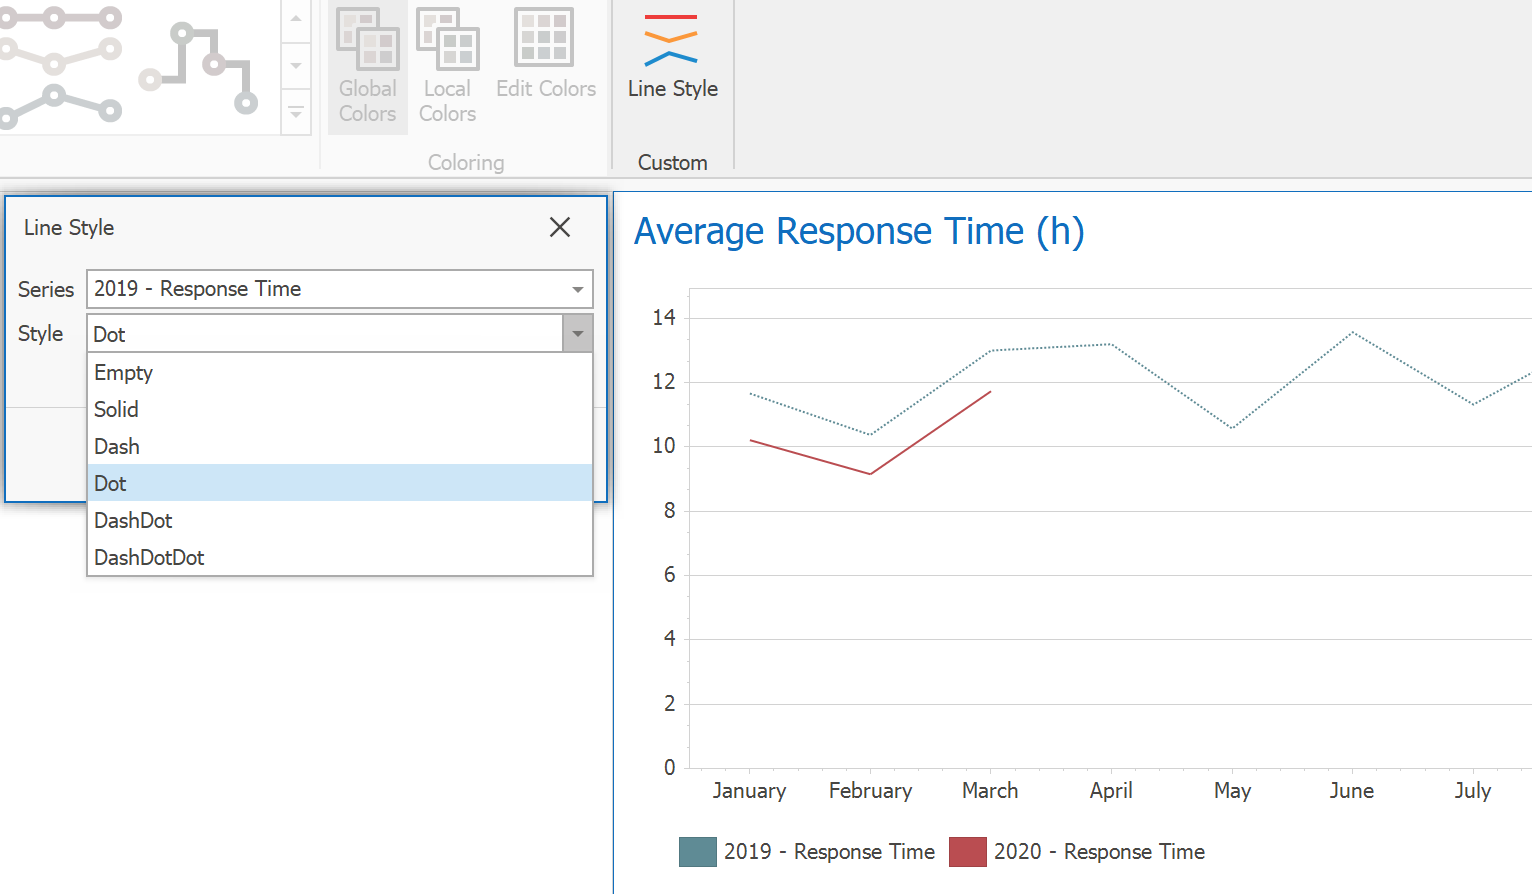
If targeting desktops, you'll want to customize your WinForms Designer & Viewer to read and write the same metadata from the same XML Dashboard file.
If you want to add similar settings to WinForms Dashboard Designer, use the simplified Ribbon API:
var page = ribbon.GetDashboardRibbonPage(DashboardBarItemCategory.ChartTools, DashboardRibbonPage.Design);
RibbonPageGroup group = page.GetGroupByName("Custom Properties");
if(group == null) {
    group = new RibbonPageGroup("Custom Properties") { Name = "Custom Properties" };
    page.Groups.Add(group);
}
Next, you'll need to create a custom XtraForm and display it to your users:
For the last step, you'll need to subscribe to the DashboardItemControlUpdated event and use its extended context to read custom properties and configure your Chart accordingly.
void Designer_DashboardItemControlUpdated(object sender, DashboardItemControlEventArgs e) {
    if(e.ChartControl != null) {
        var chartItem = designer.Dashboard.Items[e.DashboardItemName] as ChartDashboardItem;
        var context = e.ChartContext;

        var dashboardSeries = chartItem.GetRelatedSeries("LineTypeProperty");
        foreach(var series in dashboardSeries) {
            SeriesLineStyle seriesLineStyle = SeriesLineStyle.GetStyle(series.CustomProperties.GetValue("LineTypeProperty"));
            if(seriesLineStyle != null) {
                Series chartSeries = context.GetChartSeries(series).FirstOrDefault(x => x.Name.Contains(seriesLineStyle.SeriesName));
                if(chartSeries != null) {
                    LineSeriesView view = chartSeries.View as LineSeriesView;
                    if(view != null) {
                        view.LineStyle.DashStyle = seriesLineStyle.Style;
                    }
                }
            }
        }
    }
}
As you can see below, your dashboard will utilize the same data within the WinForms Designer & Viewer.

This is just a simple example. You can apply the same customization within the WPF Dashboard Viewer control. You can also utilize it during export operations via our new Export Customization API. We will share additional examples in the ooming weeks and make them available in our GitHub Examples repo. Please stay tuned!
Note: This demo is available for both the Web and WinForms version of DevExpress Dashboard (EAP installation is required to open the link).
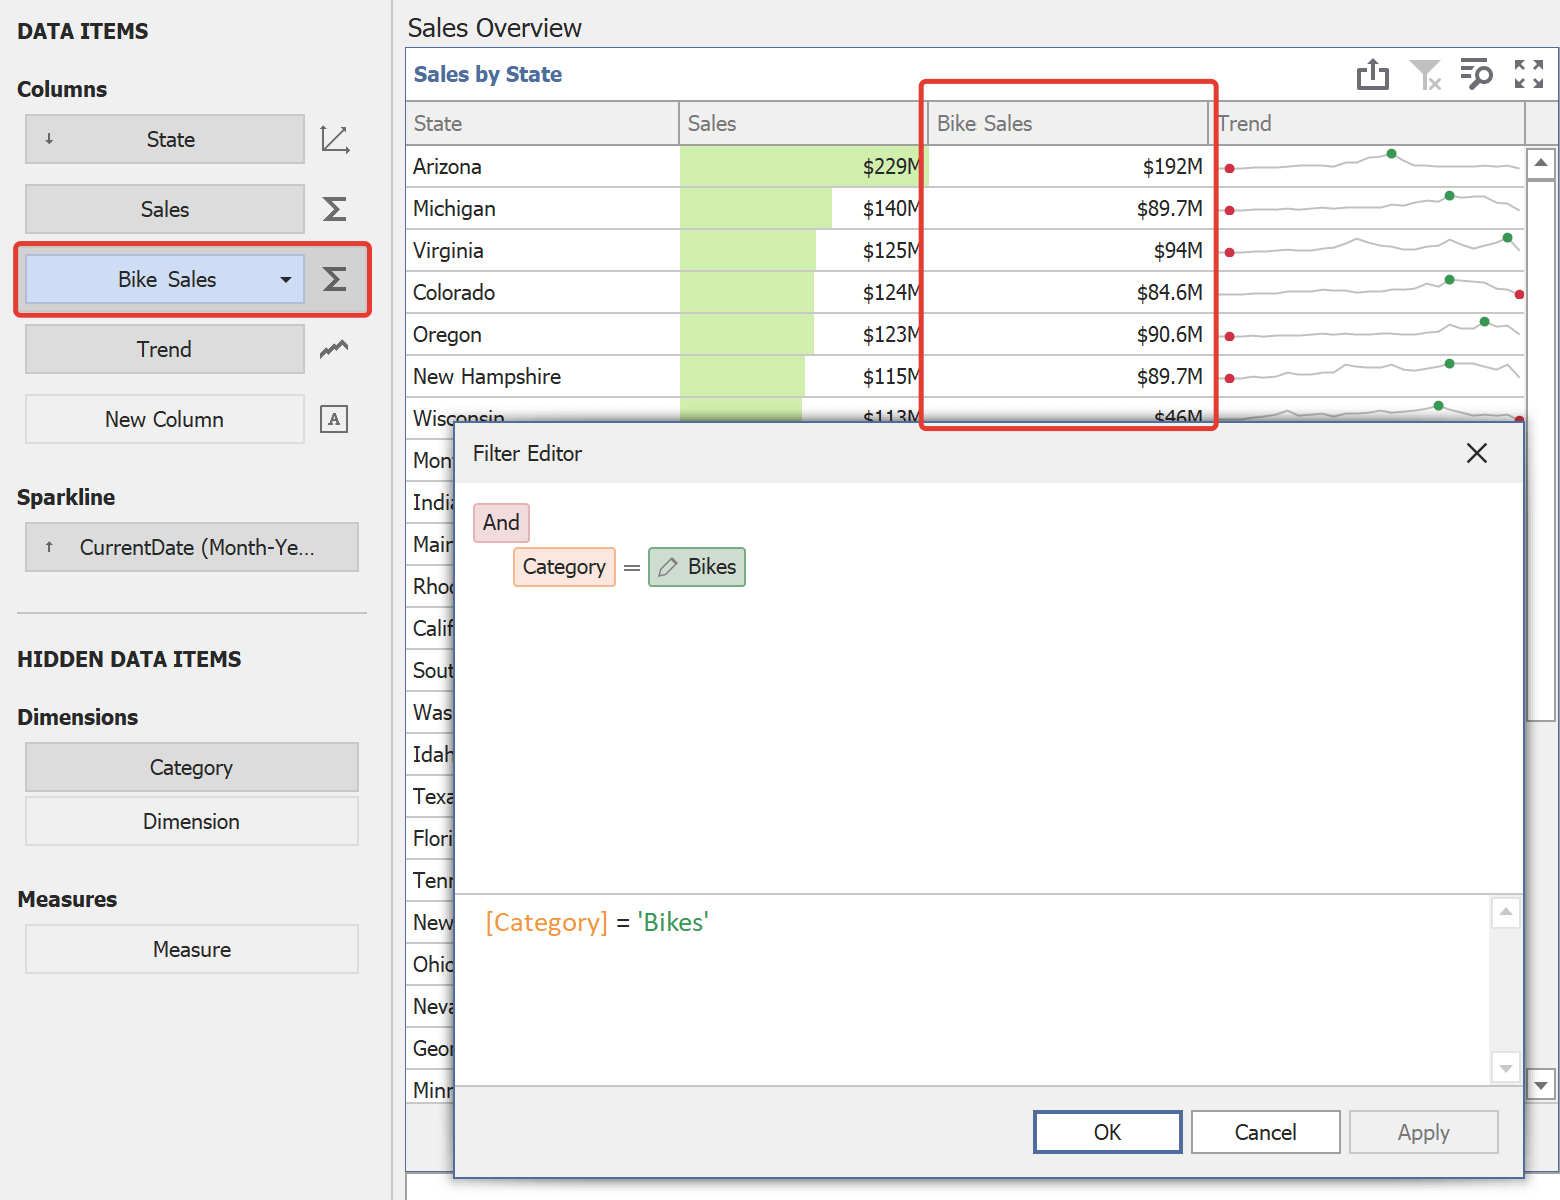
Measure Filter
You can now set up a Filter expression for a single Measure bound to your Dashboard Item (i.e. you can filter a single Measure to be calculated only for a specific time period or for a single Product Category, etc).
This feature was not planned, but we needed it internally for the better Parallel Period support. We decided to publish it because it addresses use cases that you've shared with us in the past.
Tab Item – Performance Optimization Mode
We added new options for WinForms and WPF platforms so you can configure how Dashboard Items within Inactive Tabs are loaded during the first data load – always or on demand. Please note the documented restrictions on the Dashboard Items load order. We must always load data for Master Filter Item, even when it's placed on the Inactive Tab.
Export Customization API
v20.1 includes our new Export Customization API. Now, you can maintain maximum customization of XRControls. For our upcoming release, we chose to extend support for our most popular UI controls - Charts and Gauges. One of the entry points to the new API is the GetPrintableControl method. We updated the CustomerSupport demo to demonstrate this new approach. You can find it in the Dashboard Demo Center.
Viewer.CustomExport += OnCustomExport;
...

void OnCustomExport(object sender, CustomExportEventArgs e) {
    ChartDashboardItem chartItem = Dashboard.Items[e.ItemComponentName] as ChartDashboardItem;
    if(chartItem != null) {
        XRChart chartControl = (XRChart)e.GetPrintableControl(e.ItemComponentName);
        foreach(Series chartSeries in chartControl.Series) {
            LineSeriesView view = chartSeries.View as LineSeriesView;
            if(view != null)
                view.LineStyle.DashStyle = DashStyle.Dot;
        }
    }
}
JSON Data Source - Parameters Support
You can now bind your Dashboard Parameters to JSON Path Parameters and Query Parameters (for both the WinForms and Web version of DevExpress Dashboard).

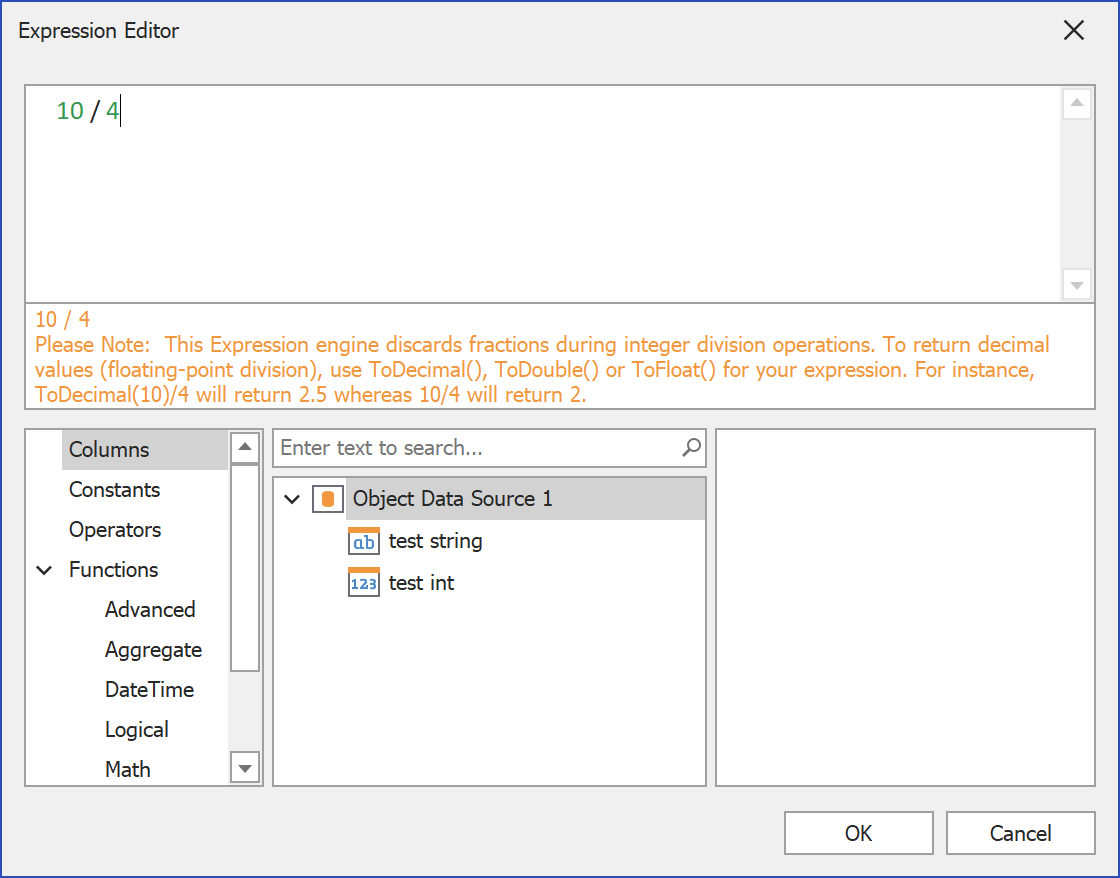
Visual Warning in Expression Editor
We added a visual indicator – a warning icon – to our WinForms Expression Editor. In our EAP release, this indicator warns users that wish to execute [int] / [int] division – an action that can produce unexpected results. Some users may expect Excel-like behavior [int] / [int] = [double] (i.e. 10 / 4 = 2.5) in this scenario. As you may know, we historically stick to the .NET C# [int] / [int] = [int] approach in this situation (i.e. 10 / 4 = 2). This difference can obviously lead to data loss and as such, we decided to add a warning when [int] to [int] division is created in an Expression.
Comments in Calculated Fields
In case you missed it – with v19.2.5 and higher, you and your users can add Comments to your Calculated Fields. This feature should help improve readability for complex expressions (together with Line Breaks and Spaces in Calculated Fields which was introduced in our v19.2.3 release).
Rich Text Editor for TextBox Item in Web
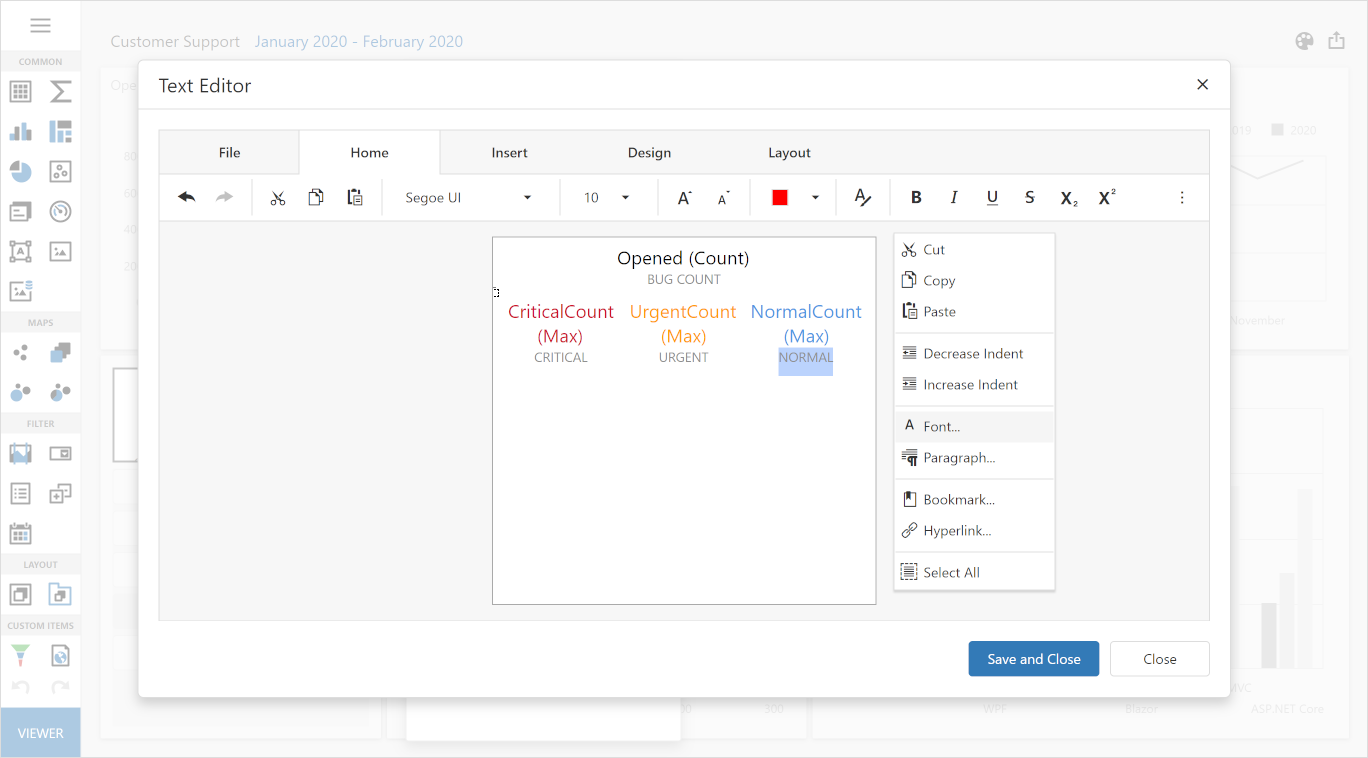
We recently mentioned the availability of Rich Text Editor for TextBox Dashboard Items (available as a CTP in our v19.2.6 release). Rich Text Editor will be officially released in our v20.1 release cycle.
In the Works
Card Item Conditional Formatting
While we decided to not include this feature in the Early Access Preview release, the progress of this feature is moving along nicely.
We have already created and mostly finalized the Model for CardConditional Formatting Rules. Our data engine is can already calculate the required rules and pass results to WinForms, Web and WPF user interfaces. The only missing piece is the Designer portion of Web / WinForms Dashboard Designers.
As we promised, you will be able to create conditional formatting based on the Measure (Actual or Target Values), Series Dimension AND you will be able to set up a highlighting rule based on the delta between Actual / Target.
You will be able use Formatting Styles similar to those used for Grid / Pivot Grid conditional formatting. You will be able to change selected Card element Font, add an Icon or apply the background color to the entire Card.
We expect this feature to be available in our v20.1 Beta (v20.1.2) in early April.
Parallel Periods
We plan to incorporate additional enhancements for parallel periods in our v20.1 release.
We are working on this feature and already shared intermediate results with you (see Measure Filter above). We prepared a demo that shows how you can utilize Measure Filter to compare data between Parallel Periods (in Charts, Grids, in Delta columns). The demo is available online and in our WinForms Demo Center (Early Access Preview should be installed).
We are presently reconsidering UI/UX options for this feature.
Year-Week Group Interval
This feature is still on target for our v20.1 release.
Your Feedback Matters
As always, we welcome your feedback. Please post your comments below or create a new support ticket if you've beta tested our Early Access Preview.
Free DevExpress Products - Get Your Copy Today
 The DevExpress Team