We’ve got some good news for those looking to visualize data in new and unique ways. Our upcoming release will include a new Sankey Diagram Control (for WinForms and WPF).
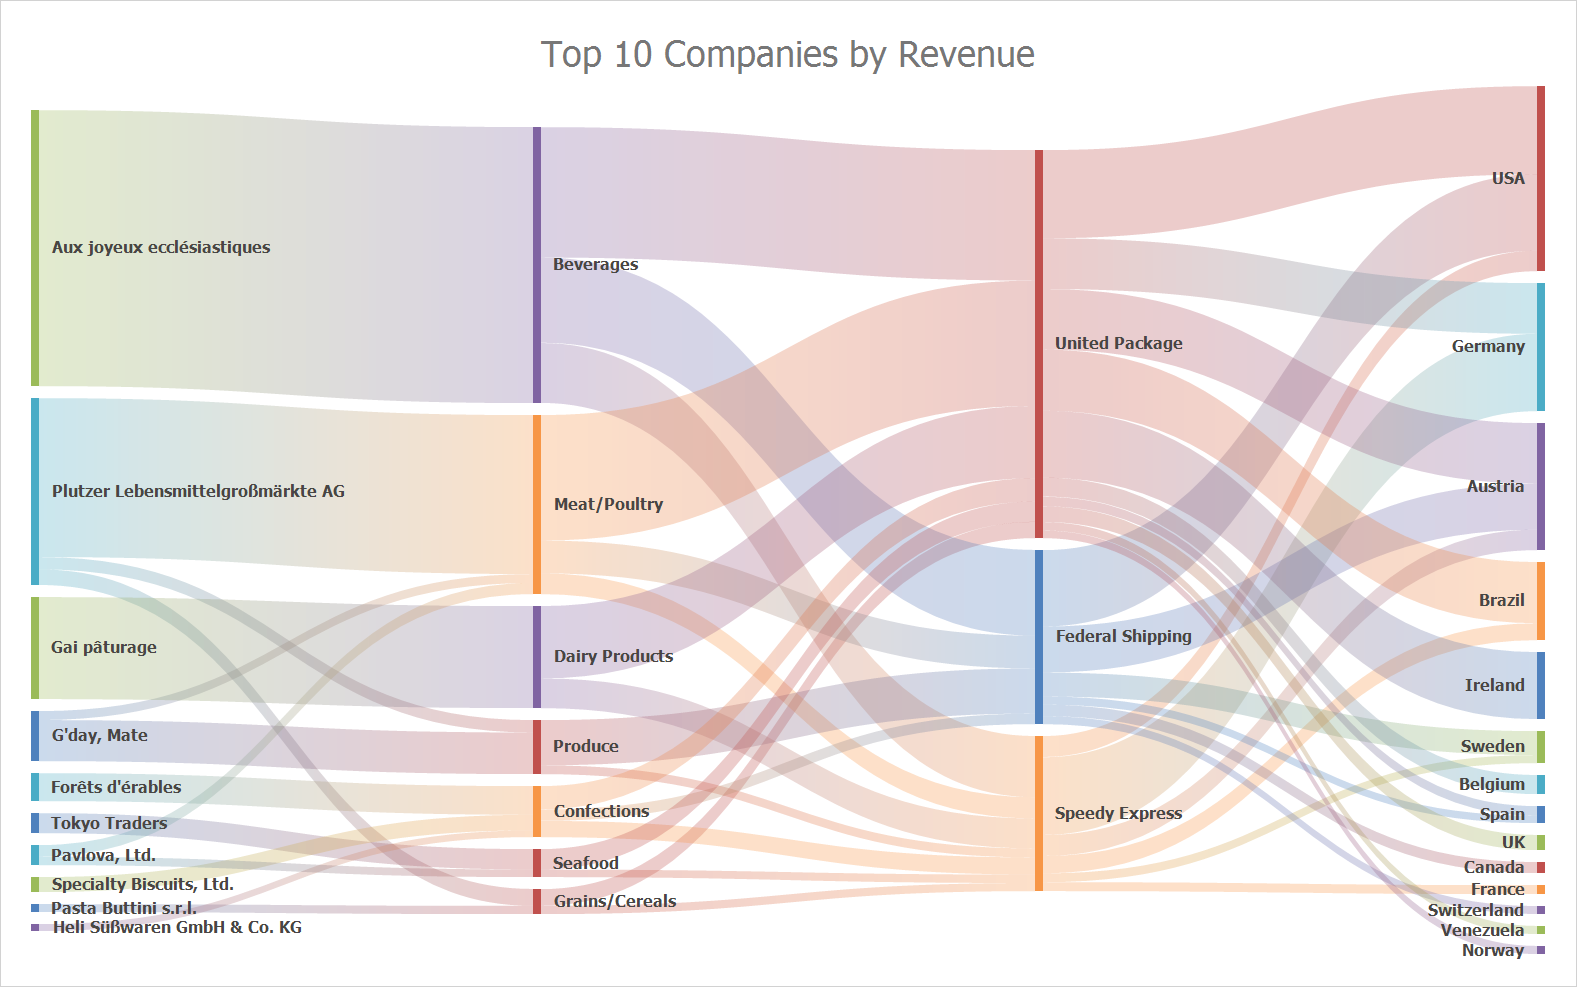
Sankey Diagrams display paths between nodes and associated quantities. The thickness of each path varies based on the value of a corresponding node. When used, end-users can easily see major paths and spot inefficiencies or losses within a given flow. These diagrams are typically used to display resource flows (sales, budget) along with information or energy usage.
Note: This Early Access Preview (EAP) only includes our WinForms implementation. We will add the Sankey Diagram control for WPF prior to official release (v20.2).

Supported Features
Here is a brief summary of the features that we’ll include in this release:
- Built-in coloring algorithms (palette-based and custom colorizers);
- Recursive Nodes and Custom Node Order;
- Title Elements;
- Printing / Export;
- Node and Link Highlighting, Tooltips.
Try It Today
If you’ve installed our v20.2 EAP build, you can explore the capabilities of our Sankey Diagram using the following WinForms demo link: Sankey Diagram demo.
You can also refer to the following help topic for additional information: SankeyDiagramControl.

Your Feedback
We welcome your feedback. If you’re considering this control for an upcoming project or if you have technical questions, please post a comment below. We’ll be happy to follow-up.
Free DevExpress Products - Get Your Copy Today
The following free DevExpress product offers remain available. Should you have any questions about the free offers below, please submit a ticket via the
DevExpress Support Center at your convenience. We'll be happy to follow-up.