Office File API & Office-Inspired Desktop UI Controls – Chart Support Enhancements (v21.1)

In our most recent major release (v21.1), we introduced new charting capabilities to our Spreadsheet components (Spreadsheet Document API, WinForms Spreadsheet and WPF Spreadsheet UI controls) and added chart support to our Word Processing products (Word Document API, WinForms Rich Text Editor and WPF Rich Text Editor).
.NET Spreadsheet (WinForms, WPF, Office File API) – Improved Support for Excel 2016 Charts
As you may already know, our DevExpress Spreadsheet Document API and our Spreadsheet UI controls support Excel 2016 charts. v21.1 extends the list of supported chart types and adds Treemap and Sunburst charts to our list. You can load, create, display, print, and export these charts to PDF as necessary.
Treemap Charts
A Treemap chart displays tree-structured data as a set of rectangles. The size of each rectangle is proportional to the amount of data in each category. Parent categories are displayed in different colors.
In the following code example, we use our Spreadsheet API to generate a simple Treemap chart:
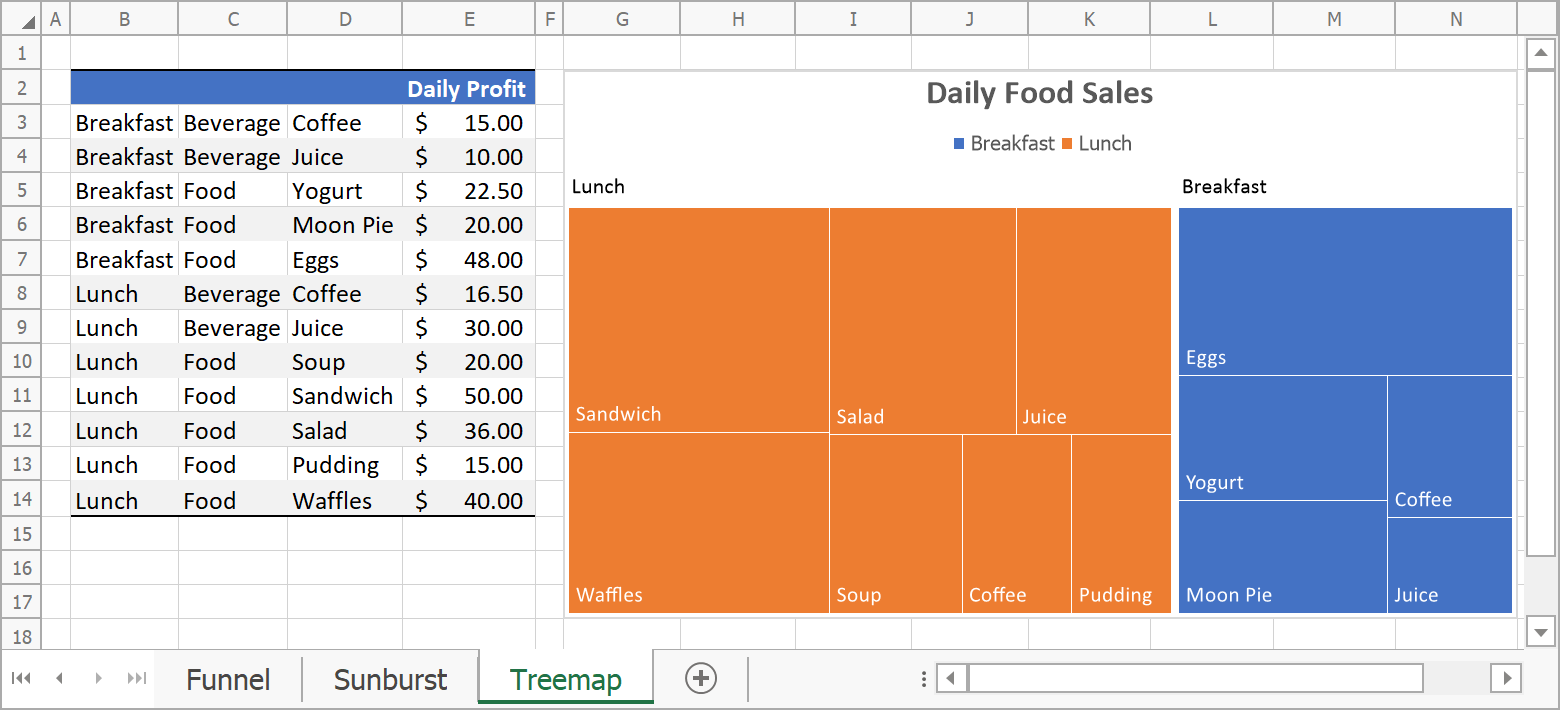
// Create treemap chart and specify its location.
Chart chart = worksheet.Charts.Add(ChartType.Treemap, worksheet["B2:E14"]);
chart.TopLeftCell = worksheet.Cells["G2"];
chart.BottomRightCell = worksheet.Cells["N17"];

// Specify series options.
var options = chart.Series[0].LayoutOptions.Treemap;
options.ParentLabelLayout = TreemapParentLabelLayout.Banner;

// Add chart title.
chart.Title.Visible = true;
chart.Title.SetValue("Daily Food Sales");
Sunburst Charts
A Sunburst chart is used to visualize hierarchical data using a circular display metaphor. The innermost ring plots top level categories, and outer rings display sub-categories.
The following code example uses sales data to generate a Sunburst chart:

// Create sunburst chart and specify its location.
Chart chart = worksheet.Charts.Add(ChartType.Sunburst, worksheet["B2:E23"]);
chart.TopLeftCell = worksheet.Cells["G2"];
chart.BottomRightCell = worksheet.Cells["O23"];

// Hide chart title.
chart.Title.Visible = false;
New UI Elements
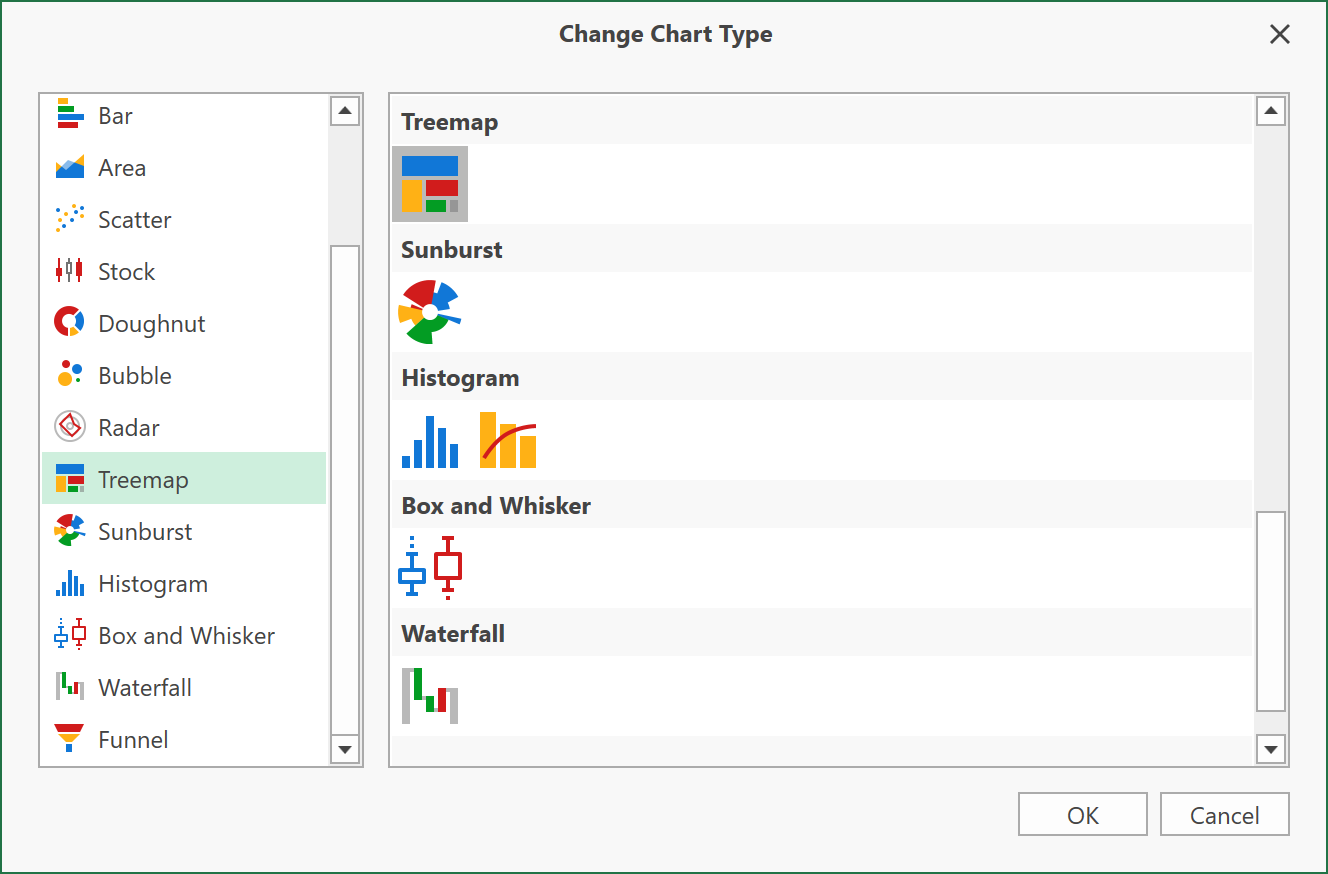
Our WinForms and WPF Spreadsheet controls ship with new ribbon commands that allow users to create Excel 2016 charts.

Excel 2016 charts are also included in the Change Chart Type dialog.
Word Processing (WinForms, WPF, Office File API) – Chart Support (CTP)
You can now use charts to visualize data in your Word documents and demonstrate relationships, patterns, and trends between data sets.
Note: In v21.1, chart support for our Word Processing products is available as a CTP (community technology preview). If you’re going to incorporate chart support into your word processing app, please share your feedback with us via the DevExpress Support Center. We'd appreciate any comments and suggestions and want to do everything possible to address your chart related requirements.
Enable Chart Support
Our Word Processing File API and our Rich Text UI controls use Spreadsheet charts to import/export, render, and print text documents with charts. To enable chart support within your word processing app, add necessary Spreadsheet assemblies to your project and use the appropriate OfficeCharts extension methods (specific to WinForms, WPF, or File API). Refer to the following help topics for additional information:
- Enable Charts for the Word Processing Document API
- Enable Charts in the WinForms Rich Text Editor
- Enable Charts in the WPF Rich Text Editor
Add Charts to Word Documents
Use our comprehensive Spreadsheet Chart API to create and modify charts in code. The following options are available:
- Create 2D and 3D charts (Column, Bar, Pie, Area, Line, Scatter, Radar, Bubble, Stock, Waterfall, Box and Whisker, Histogram, Pareto, Runnel, Treemap, and Sunburst)
- Apply chart styles and format individual chart elements
- Add or remove chart elements (chart title, primary and secondary axes, axis titles, data labels, gridlines, chart legend)
- Change type for an entire chart or an individual data series
- Remove charts
Charts are stored in the SubDocument.Shapes collection. Use the ShapeCollection.InsertChart method to add a chart to a document.
The following code example demonstrates how to create a simple clustered column chart and customize its layout:

using DevExpress.Office.Services;
using DevExpress.XtraSpreadsheet.Services;
using DevExpress.XtraRichEdit.API.Native;
using DevExpress.Spreadsheet.Charts;
using DevExpress.Spreadsheet;
using System.Drawing;
// ...

public partial class Form1 : DevExpress.XtraBars.Ribbon.RibbonForm
{
	public Form1()
	{
		// Enable chart support.
		OfficeCharts.Instance.ActivateWinFormsCharts();
        InitializeComponent();

        Document document = richEditControl1.Document;
        // Set measurement unit to inches.
        document.Unit = DevExpress.Office.DocumentUnit.Inch;
        // Create clustered column chart.
        var chartShape = document.Shapes.InsertChart(document.Range.Start,
        DevExpress.XtraRichEdit.API.Native.ChartType.ColumnClustered);
        chartShape.Name = "Largest countries chart";
        // Specify chart size and position.
        chartShape.Size = new System.Drawing.SizeF(6, 4);
		chartShape.RelativeHorizontalPosition = ShapeRelativeHorizontalPosition.Column;
		chartShape.RelativeVerticalPosition = ShapeRelativeVerticalPosition.Paragraph;
        chartShape.Offset = new PointF(0, 0);

        // Access spreadsheet chart object.
        ChartObject chart = (ChartObject)chartShape.ChartFormat.Chart;
        // Access worksheet that stores chart data.
        Worksheet worksheet = (Worksheet)chartShape.ChartFormat.Worksheet;
        // Populate worksheet with data.
		SpecifyChartData(worksheet);
        // Select chart data.
		chart.SelectData(worksheet["B2:C7"]);

        // Display chart title.
        chart.Title.Visible = true;
		chart.Title.SetValue("Top 5 Largest Countries by Area");

        //Specify that each data point has a different color.
		chart.Views[0].VaryColors = true;

        // Access value axis.
        Axis valueAxis = chart.PrimaryAxes[1];
        // Set minimum and maximum scale values.
		valueAxis.Scaling.AutoMax = false;
        valueAxis.Scaling.Max = 18000000;
		valueAxis.Scaling.AutoMin = false;
        valueAxis.Scaling.Min = 0;
        // Specify distance between major tick marks.
        valueAxis.MajorUnit = 2000000;
        // Define display units.
		valueAxis.DisplayUnits.UnitType = DisplayUnitType.Millions;
		valueAxis.DisplayUnits.ShowLabel = true;
        // Specify axis title.
        valueAxis.Title.Visible = true;
		valueAxis.Title.SetValue("Total area (square kilometers in millions)");
        // Display major gridlines.
		valueAxis.MajorGridlines.Visible = true;

        // Hide chart legend.
        chart.Legend.Visible = false;
	}

	private static void SpecifyChartData(Worksheet sheet)
	{
		// The first column.
		sheet["B2"].Value = "Country";
		sheet["B3"].Value = "Russia";
		sheet["B4"].Value = "Canada";
		sheet["B5"].Value = "USA";
		sheet["B6"].Value = "China";
		sheet["B7"].Value = "Brazil";
		// The second column.
		sheet["C2"].Value = "Total Area";
		sheet["C3"].Value = 17098246;
		sheet["C4"].Value = 9984670;
		sheet["C5"].Value = 9833517;
		sheet["C6"].Value = 9596961;
		sheet["C7"].Value = 8515767;
	}
}
Limitations
Our current chart implementation ships with the following limitations:
- Our WinForms and WPF Rich Text Editors do not contain user interface elements to insert or modify charts.
- Charts are not supported in OpenDocument Text (.odt) documents and encrypted DOC files.
Your Feedback Matters
As always, we welcome your feedback. Please feel free to leave comments below or contact us via the DevExpress Support Center. In addition, we would appreciate your response to the following quick survey:
Free DevExpress Products - Get Your Copy Today
Office Products Team