Spreadsheet Document API, Spreadsheet Controls (WinForms and WPF) — Chart Enhancements (v23.1)

We recently introduced a series of chart-related enhancements to our Spreadsheet product line (v23.1). In this blog post, I’ll summarize new features/capabilities you can incorporate in your next DevExpress-powered app/solution.
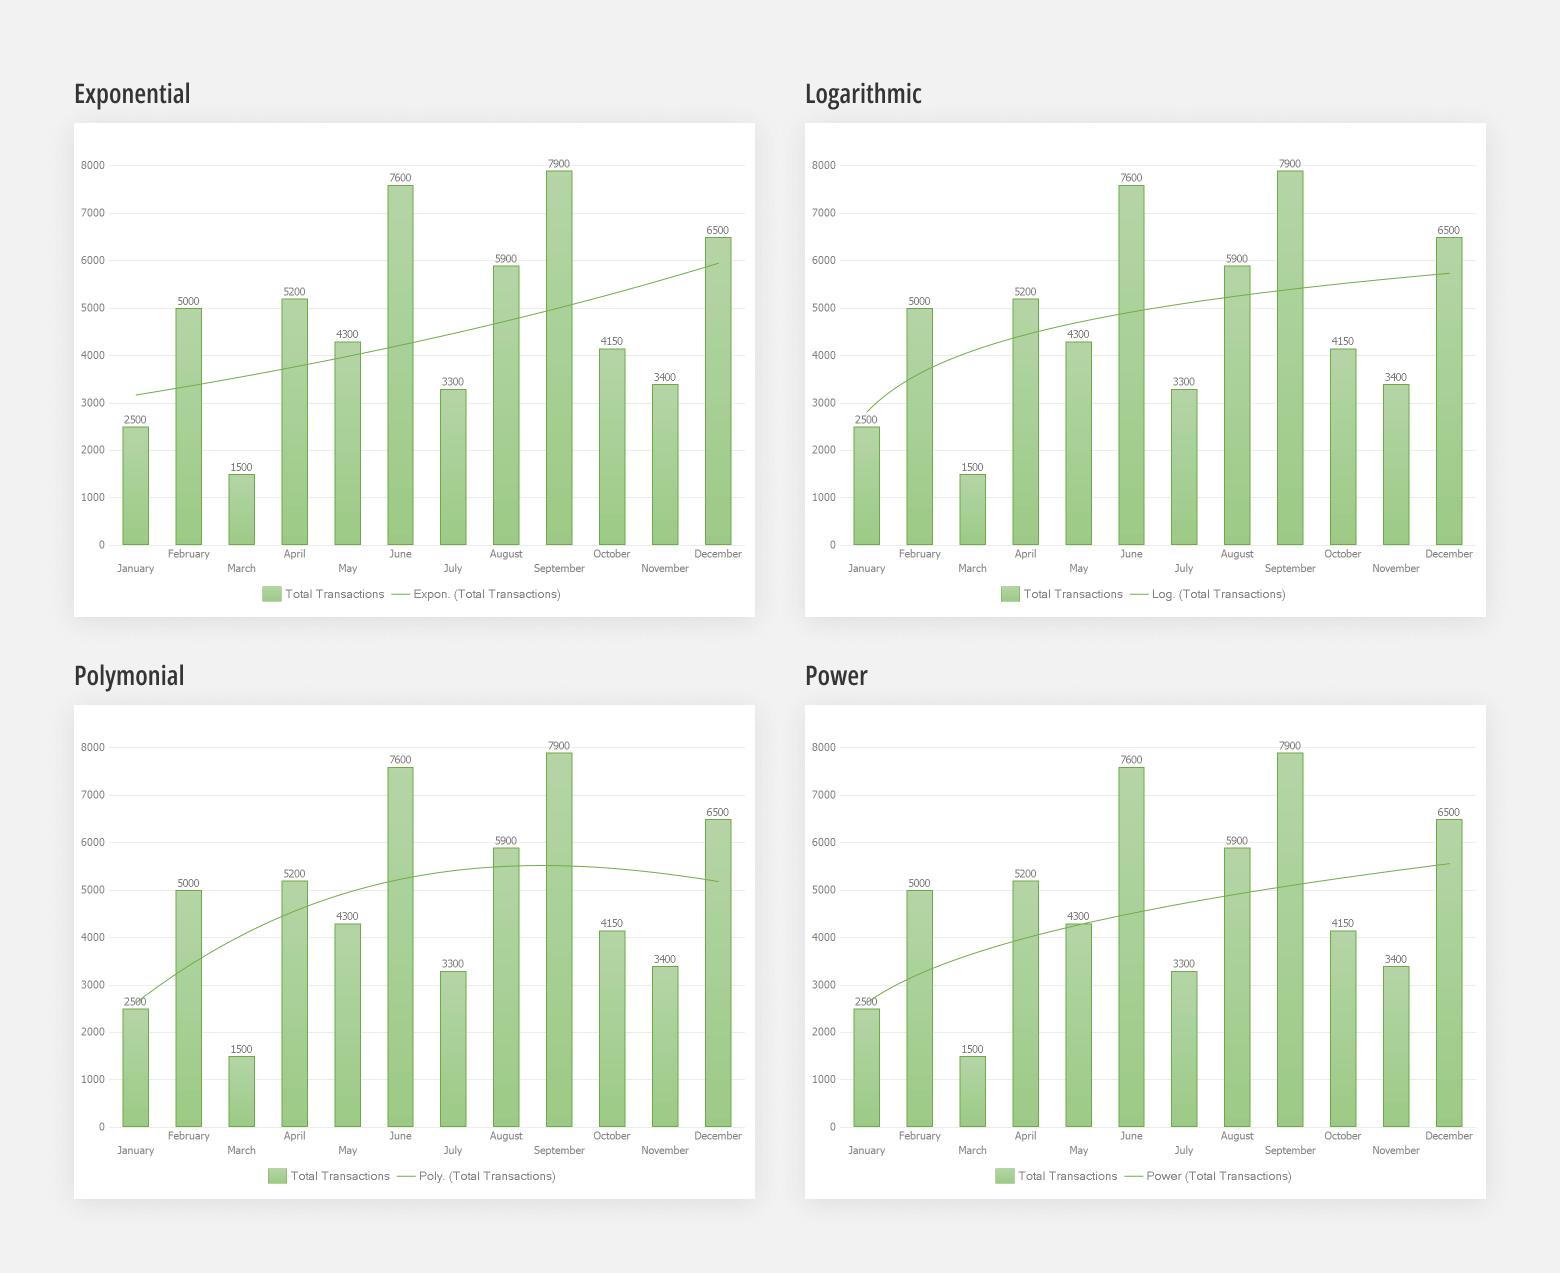
Trendlines
In a previous blog post, we previewed linear and moving average trendline support in our v23.1 release cycle (display, export, and print trendline chart types). Our official release supports the following trendlines:
- Linear
- Moving Average
- Logarithmic
- Exponential
- Polymonial
- Power
We already had an API to manage chart trendlines in our Spreadsheet Document API and within Desktop Spreadsheet controls. You could modify trendline options programmatically, save the workbook and view the document in other spreadsheet applications.
With v23.1, the corresponding members now affect how Spreadsheet displays trendlines. You can organize trendlines in code as follows:
var workbook = spreadsheetControl.Document;
Worksheet worksheet = workbook.Worksheets["chartTask3"];
workbook.Worksheets.ActiveWorksheet = worksheet;

// Create a chart and specify its location.
Chart chart = worksheet.Charts.Add(ChartType.ScatterMarkers);
chart.SelectData(worksheet["C2:F3"], ChartDataDirection.Row);
chart.TopLeftCell = worksheet.Cells["H2"];
chart.BottomRightCell = worksheet.Cells["N14"];

// Display a polynomial trendline.
chart.Series[0].Trendlines.Add(ChartTrendlineType.Polynomial);

// Customize the trendline.
Trendline tline = chart.Series[0].Trendlines[0];
tline.DisplayEquation = true;
tline.CustomName = "Trend";
tline.DisplayRSquare = true;
tline.Outline.SetSolidFill(Color.Red);
Data Tables
Data tables display values that are plotted on a chart within a grid. Data tables allow you to present detailed information alongside the visual representation of the data itself. They can include additional dimensions, measurements, labels, and values that might not be readily apparent in the chart itself. This helps users analyze underlying data and make more informed interpretations.

Our SpreadsheetControls can now display, export, and print charts with data tables. You can also use the Chart API to enable data tables as follows:
using DevExpress.Spreadsheet;
using DevExpress.Spreadsheet.Charts;

//...
Worksheet worksheet = workbook.Worksheets["chartTask5"];
// Create a chart and specify its location
Chart chart = worksheet.Charts.Add(ChartType.Line, worksheet["B2:C8"]);
chart.TopLeftCell = worksheet.Cells["F2"];
chart.BottomRightCell = worksheet.Cells["L14"];

// Display a data table
// and hide legend keys
DataTableOptions dataTableOptions = chart.DataTable;
dataTableOptions.Visible = true;
dataTableOptions.ShowLegendKeys = false;
Cell Values as Data Labels
The SpreadsheetControl (WinForms and WPF) now displays, prints, and exports charts with data labels retrieved from cell values.

We added the DataLabelCollection.SetReference method to specify the cell range that supplies values for data labels. You can use the new API as follows:
using DevExpress.Spreadsheet;
using DevExpress.Spreadsheet.Charts;

Worksheet worksheet = workbook.Worksheets["chartTask5"];
workbook.Worksheets.ActiveWorksheet = worksheet;

// Create a chart and specify its location
Chart chart = worksheet.Charts.Add(ChartType.ColumnClustered, worksheet["B2:C8"]);
chart.TopLeftCell = worksheet.Cells["F2"];
chart.BottomRightCell = worksheet.Cells["L15"];

// Specify the chart style
chart.Style = ChartStyle.ColorGradient;
chart.Series[0].UseCustomDataLabels = true;
var customDataLabels = chart.Series[0].CustomDataLabels;
customDataLabels.SetReference(worksheet["D3:D8"]);
Please note that Spreadsheet controls (WinForms and WPF) ignore the value format applied for cell values used as data labels and display values with general formatting.
What’s Next
We value your feedback on the chart-related capabilities within our Spreadsheet product line. To improve our chart implementation, please take a moment to complete the survey below.
What's New in v23.1
If you have yet to review the features/capabilities introduced in our most recent major update, please visit the following webpage and let us know what you think of this release by responding to our online survey: Explore Our Newest Features (v23.1).
Free DevExpress Products - Get Your Copy Today
 Polina Fedorova (DevExpress)