When it comes down to it, I am a programmer. That is what I went to school for: it’s what I like to do. While wizards and drag-and-drop are really cool, sometimes we just want to get down to the code and do things ourselves. This is particularly true when we want to generate certain types of documents like Word Documents, PDF’s, or spreadsheets. In upcoming release of .NET Spreadsheet control we introduce a new API which allows to create or modify embedded charts programmatically.
Using Spreadsheet Chart API you can:
- Create new chart of predefined type (Bar/Column, Line, Pie, etc.) using data from specified cell range;
- Enumerate existing charts embedded to worksheet;
- Find existing chart by id or name;
- Setup chart Z-order and position (using cells as anchor points);
- Change chart type, select data from cell range or specify literal data, toggle row/column data;
- Add, remove, reorder chart series, change series type or data references;
- Adjust axis properties (like position, orientation, scaling, min/max values, etc.);
- Adjust chart and axis titles;
- Apply predefined style to whole chart or adjust formatting (fill, outline, font) of chart objects (plot area, legend, series, data points);
- Adjust data labels, markers, trend lines, error bars, etc.;
- Copy chart to another worksheet.
For example, let’s create complex chart based on the following data:
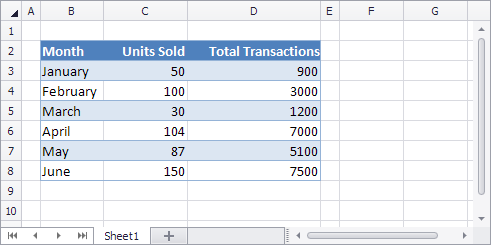
First, add a couple of namespaces:
using DevExpress.Spreadsheet;
using DevExpress.Spreadsheet.Charts;
using DevExpress.Spreadsheet.Drawings;
Next create column clustered chart using data from specified cell range:
IWorkbook workbook = spreadsheetControl1.Document;
Worksheet worksheet = workbook.Worksheets.ActiveWorksheet;

Chart chart = worksheet.Charts.Add(ChartType.ColumnClustered, worksheet["B2:D8"]);
And setup chart position:
chart.TopLeftCell = worksheet.Cells["F2"];
chart.BottomRightCell = worksheet.Cells["M18"];
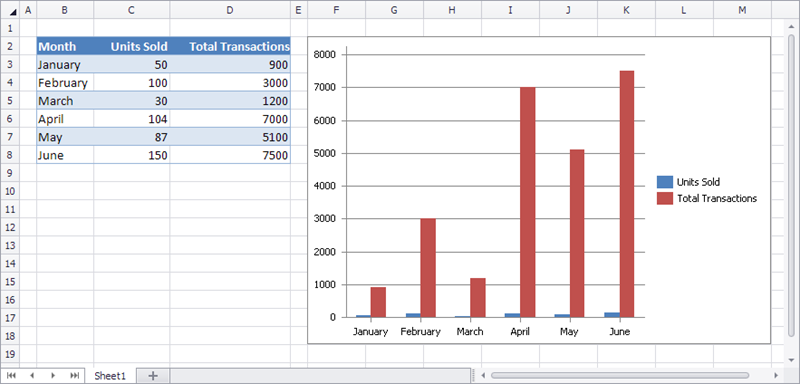
Change type of second series and use secondary axes to make chart easy to read:
chart.Series[1].ChangeType(ChartType.Line);
chart.Series[1].AxisGroup = AxisGroup.Secondary;
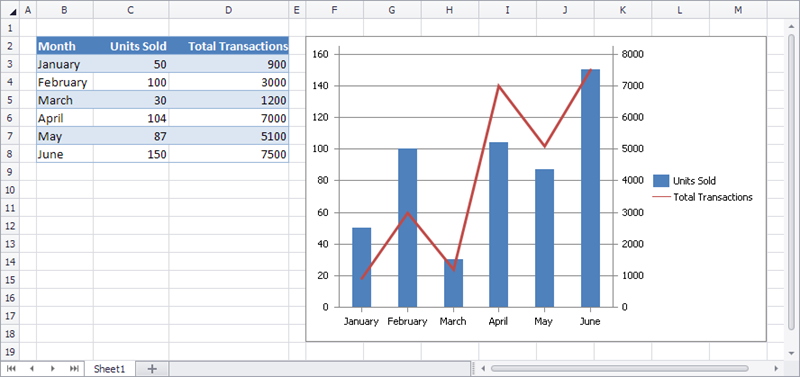
Adjust legend position and apply chart style:
chart.Legend.Position = LegendPosition.Bottom;
chart.Style = ChartStyle.ColorGradient;
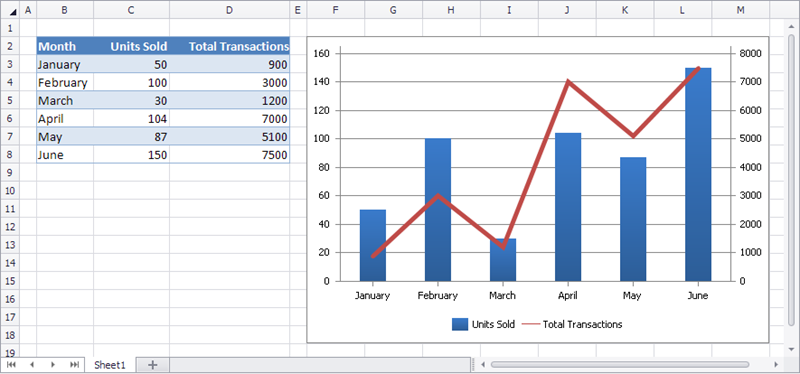
Finally setup chart title, primary and secondary value axis titles and secondary value axis number format:
chart.Title.SetValue("My Sales");
chart.PrimaryAxes[1].Title.SetValue("Units sold");
chart.SecondaryAxes[1].Title.SetValue("Total transactions");
chart.SecondaryAxes[1].NumberFormat.FormatCode = "$#,##0";
chart.SecondaryAxes[1].NumberFormat.IsSourceLinked = false;
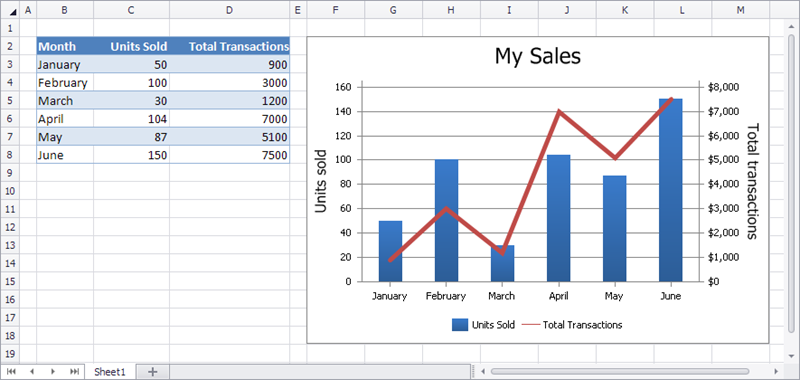
Done! Notice how clean the API is to work with. This truly makes it super easy to generate any kind of spreadsheet in code.
As always, if there are any comments and/or questions, feel free to get a hold of me!
Seth Juarez
Email: sethj@devexpress.com
Twitter: @SethJuarez
Free DevExpress Products - Get Your Copy Today
The following free DevExpress product offers remain available. Should you have any questions about the free offers below, please submit a ticket via the
DevExpress Support Center at your convenience. We'll be happy to follow-up.