This post outlines some of the DevExpress BI Dashboard related features we expect to ship in our next major release (v21.2). If you are an active Universal subscriber, please take a moment to download our Early Access Preview (EAP) and share your feedback with us. Your comments will help us fine-tune our implementation before official release in November. Active Universal subscribers can download the EAP build via the DevExpress Download Manager (if you own a DXperience Subscription, you can install the DevExpress Dashboard EAP in evaluation mode).
This post also includes enhancements and new features we expect to introduce across our data visualization components (DevExpress Chart and Map Control for WinForms, WPF and ASP.NET).
Important Note: This post does not contain information about our data visualization components for JavaScript (Angular, Vue, jQuery, React).
Early Access and CTP builds are provided solely for early testing purposes and are not ready for production use. This build can be installed side by side with other major versions of DevExpress products. Please backup your project and other important data before installing Early Access and CTP builds.
This EAP may not include all features/products we expect to ship in our v21.2 release cycle. As its name implies, the EAP offers an early preview of what we expect to ship in two months.
Dashboard - Enhanced Layout Capabilities (Dashboard Viewer and Dashboard Designer)
We extended the DevExpress Dashboard’s layout capabilities with new layout options.
Prior to this release, a dashboard was automatically resized to populate the Dashboard Viewer’s entire display region (to fully fit the screen). You can now customize the default display mode and specify the dashboard’s surface height and width. This feature will be of value if your dashboard uses a scrollable layout or if you need to tailor the dimensions of your dashboard for a specific screen size.
You can also mix layout settings and use adaptive size for width and fixed size for height.

If you’re an active Universal or DXperience subscriber, and have installed our EAP, select one of the following to explore this feature in greater detail: Sales Performance dashboard (WinForms) | Sales Performance dashboard (WPF)
Try it online: Web Dashboard demo (v21.2 EAP)
Dashboard - Custom Aggregation Functions
Along with the predefined aggregations, Dashboard now supports custom aggregation functions in client mode.
Refer to the following example to implement a custom aggregation function:
https://github.com/DevExpress-Examples/winforms-dashboard-custom-aggregates
Web Dashboard - End of support for Internet Explorer 11
All good things must come to an end. With v21.2, we will officially end support for Internet Explorer 11 (IE 11). For additional information, please refer to following blog post: DevExtreme and related products: End of support for Internet Explorer 11.
Charts - Customizable Empty Points (for WinForms, WPF and ASP.NET)
The DevExpress Chart Control can process gaps in a data source as empty points (points with undefined values). These gaps can now be visualized using different style options (based on Series view type). You can fully customize the appearance of point markers, line and area segments used to display empty points.
You can also draw “mock” points instead of gaps (based on values of neighboring Series points). To use this feature, set the series view’s EmptyPointOptions.ProcessPoints property to Interpolate.

Documentation: Empty Points (WinForms) | Empty Points (WPF)
If you’re an active Universal or DXperience subscriber, and have installed our EAP, select one of the following to explore this feature in greater detail: Empty Points (WinForms) | Empty Points (WPF)
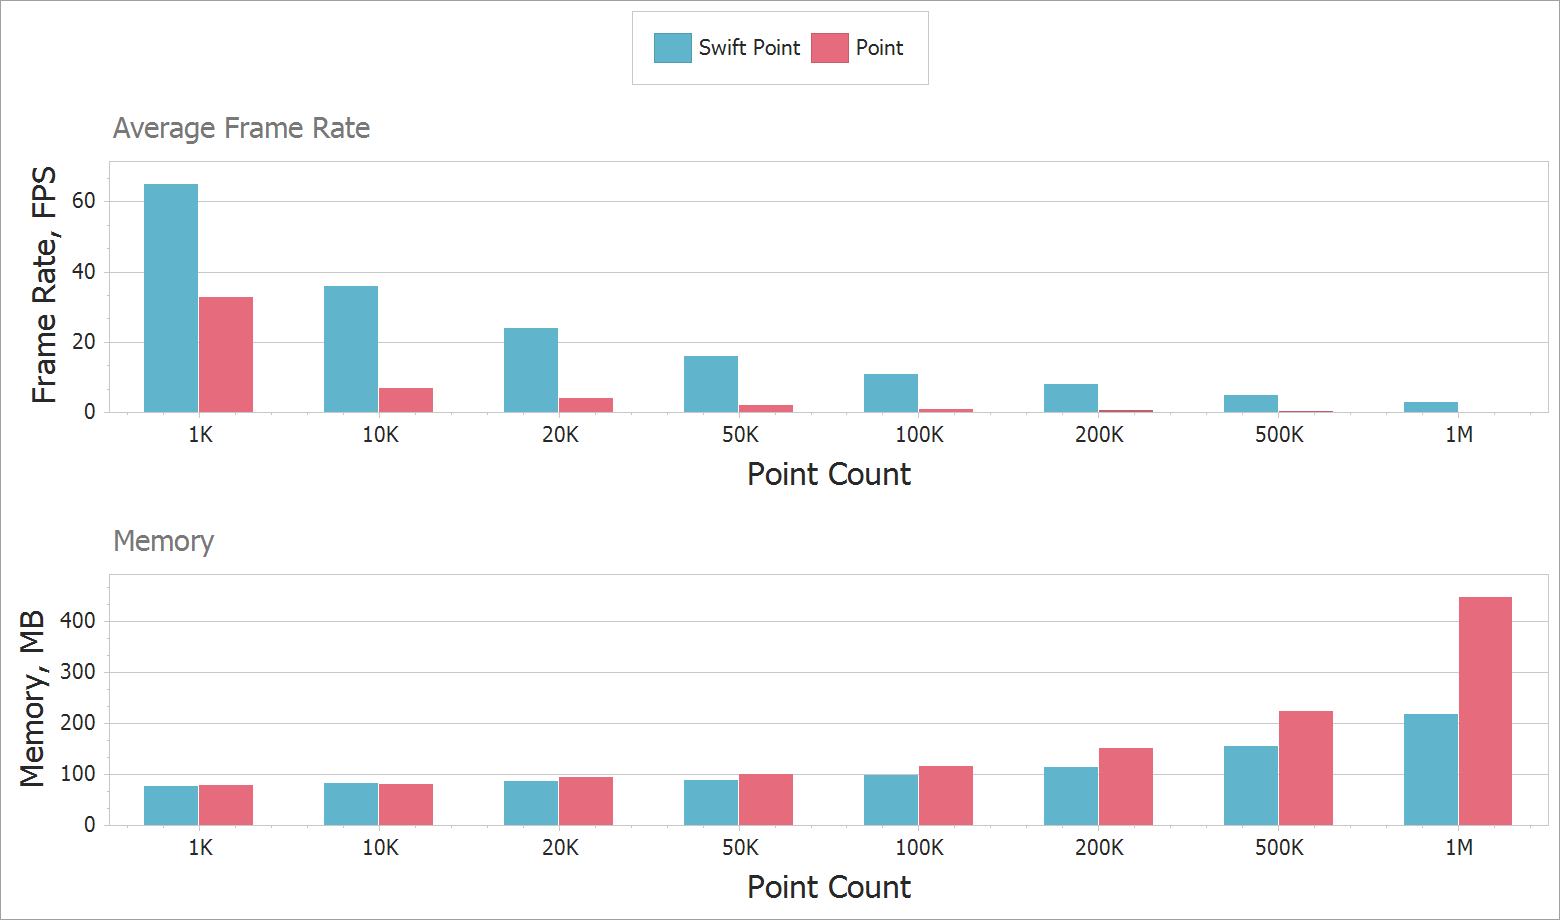
Charts - Fast (Swift) Point Series (WinForms and ASP.NET)
We added a new lightweight Swift Point Series optimized to quickly render large data sets as a scatter (XY) plot.

The following chart summarizes the benefits of a Swift Point versus a regular Point Series with default settings enabled:
Documentation: SwiftPointSeriesView
If you’re an active Universal or DXperience subscriber, and have installed our EAP, use the following link to explore this feature in greater detail: Swift Point View (WinForms)
New Heat Map Control (WinForms)
v21.2 includes a new WinForms Heatmap Control that you can use to plot heatmap charts. Heatmaps help visualize data using a tabular layout (through color variations).

The following is a summary of Heatmap related features included in this release:
- Binding to various data source types
- Unbound mode support
- Multiple coloring algorithms
- Zoom and scroll operation support
- Cell highlighting modes
- Tooltip support
- Titles
- Cell labels
Documentation: HeatmapControl
If you’re an active Universal or DXperience subscriber, and have installed our EAP, use the following link to explore this feature in greater detail: Heatmap - Color Providers (WinForms)
Maps - Create Lines, Polylines and Polygons from a View Model (MVVM enhancements) (WPF)
In our on-going effort to enhance our MVVM bindings, we extended ListSourceDataAdapter to generate lines, polylines, and polygons from a collection of coordinates in a View Model.
We added two new mapping types (MapLineMappingInfo and MapMultipointItemMappingInfo) for lines and multi-point shapes (MapPolylines and MapPolygons).
Documentation: MapLineMappingInfo | MapMultipointItemMappingInfo
If you’re an active Universal or DXperience subscriber, and have installed our EAP, use the following link to explore this feature in greater detail: Map Arrows (WPF)
Maps - Lambert Azimuthal Equal-Area projection support (WinForms, WPF)
This release includes support for a new projection type – the European Terrestrial Reference System 1989 - Lambert azimuthal equal-area (ETRS89-LAEA) projection. To enable this new projection, set the GeoMapCoordinateSystem.Projection property to Etrs89LambertAzimuthalEqualAreaProjection.
You can use this projection to display European Union (EU) maps with minimal distortion.

If you’re an active Universal or DXperience subscriber, and have installed our EAP, select one of the following to explore this feature in greater detail: Map Projections (WinForms) | Map Projections (WPF)
Free DevExpress Products - Get Your Copy Today
The following free DevExpress product offers remain available. Should you have any questions about the free offers below, please submit a ticket via the
DevExpress Support Center at your convenience. We'll be happy to follow-up.