In this post, we’ll summarize DevExpress BI Dashboard-related development plans for our mid-year update (v23.1) and hopefully address some of your questions along the way. Should you require additional information on a specific feature, or if you’d like to share a business use case that our product does not support, feel free to submit your comments in the survey at the end of this article. We’ll be happy to follow up.
The information contained within this blog post details our current/projected development plans. Please note that this information is being shared for INFORMATIONAL PURPOSES ONLY and does not represent a binding commitment on the part of Developer Express Inc. This roadmap and the features/products listed within it are subject to change. You should not rely on or use this information to help make a purchase decision about Developer Express Inc products.
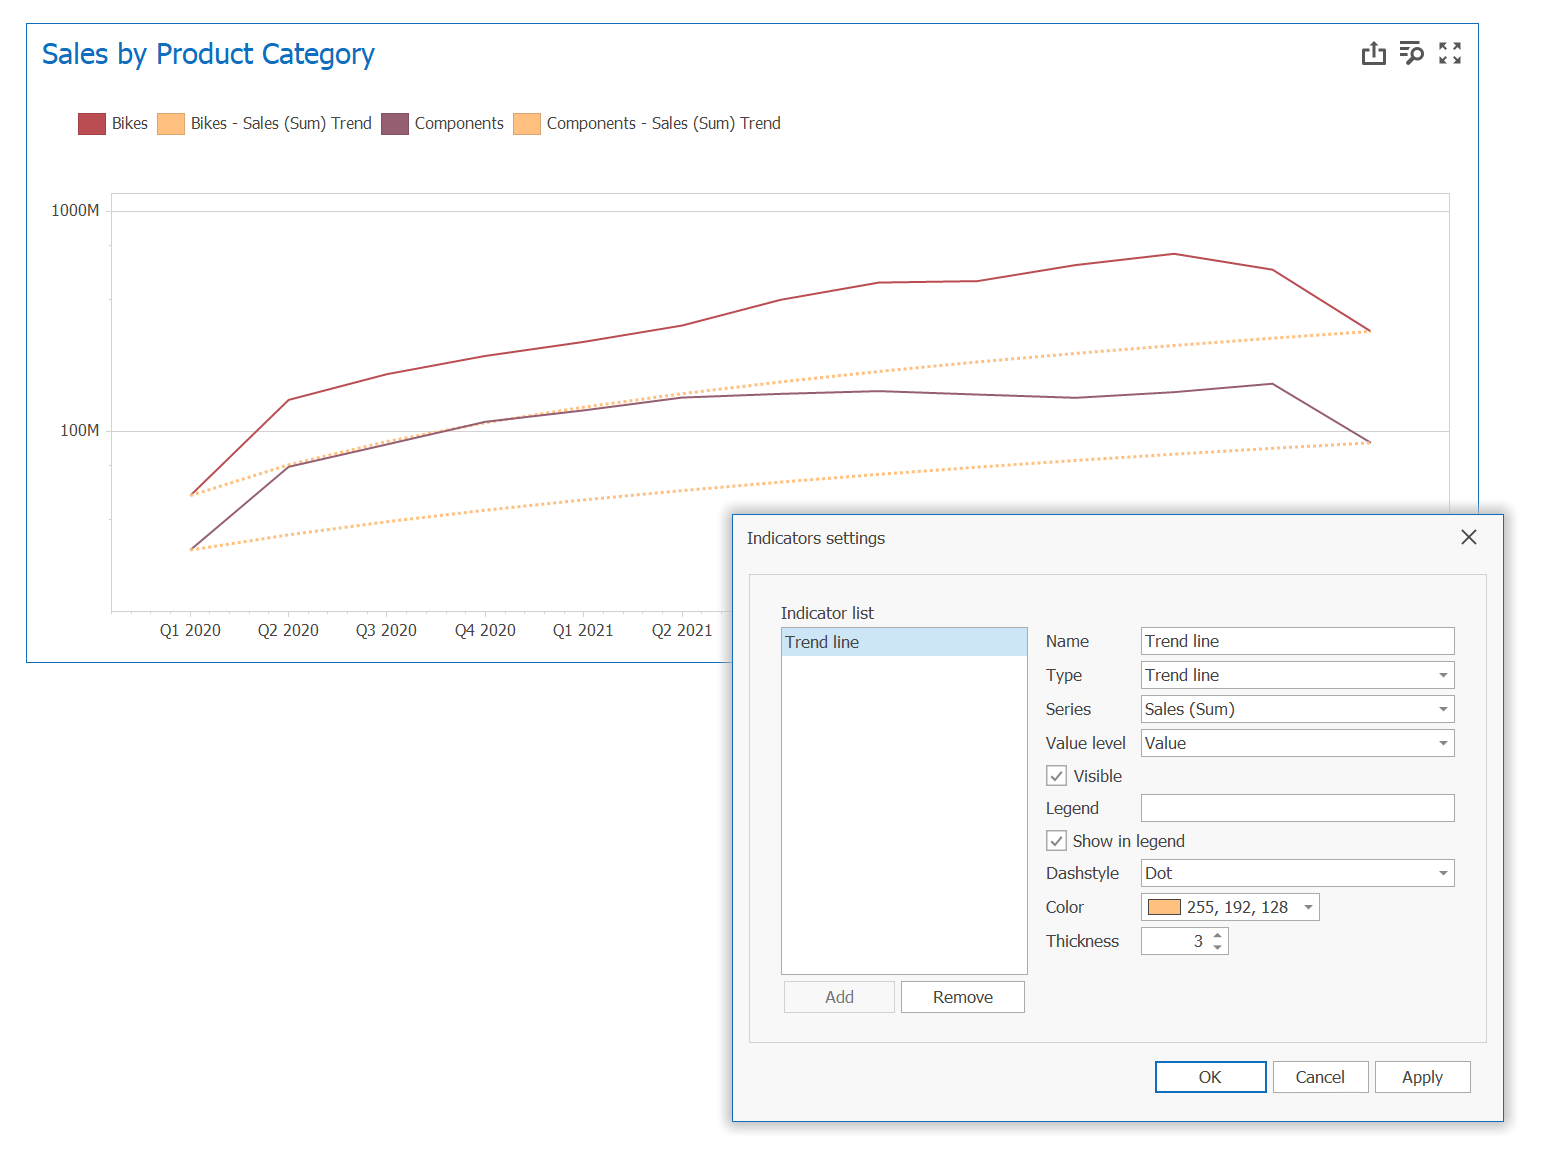
Chart Dashboard Item — Display Trendlines and Regression Lines
All Platforms
Released in v23.1
Our next release will allow you to create and display both trend and regression line types within Chart Dashboard Items (across all supported platforms). Trendlines and regression lines are both statistical tools used to analyze data and identify patterns or relationships between variables.
A trendline displays the general direction of associated points. It is often used to identify existing data trends and can help forecast future trends.
Unlike a trendline, a regression line visualize data using a mathematical formula that minimizes the distance between the line itself and associated data points. It is used to model the relationship between two variables and can be used to make predictions about one variable based on the value of the other variable.
Pivot Grid Dashboard Item — Customize Export
All Platforms
Released in v23.1
In our next release, you'll be able to customize Pivot Grid Dashboard Item export results. We'll introduce a public API to help you to obtain the XRPivotGrid object at runtime and specify its setting before data export. For instance, you'll be able to hide rows/columns, modify pivot grid field settings, specify text and data formatting, etc.
ASP.NET Core
ASP.NET WebForms
ASP.NET MVC
Blazor
Released in v23.1
Once we release v23.1, you'll be able to define a custom style when creating format rules for Grid, Pivot and Card dashboard items. Our custom style settings dialog will allow you to specify the following style properties:
- Font name
- Font style
- Text color
- Background color

Web Dashboard — Content Security Policy — Suppress Inline Styles and Scripts
ASP.NET Core
Released in v23.1
Content Security Policy (CSP) is a security feature that allows web developers to control resources a browser is allowed to load for a given page. One of the directives that can be included in a CSP policy is "unsafe-inline", which, as the name suggests, allows the use of inline JavaScript and CSS. However, the use of inline code can represent a security risk, as it can be easily exploited by attackers to inject malicious code into a web page.
To help developers mitigate this risk, we'll modify our implementation and allow web developers to use a nonce-based approach to allow specific, trusted inline code execution. It's important to note that this nonce-based approach will not only improve the security. It will also increase the performance of the website as the browser will no longer have to evaluate the script or style on every page load.
A nonce-based approach involves the use of a unique, one-time-use value that is generated for each page load and included in the CSP policy. This value, known as a nonce, is then included in the nonce attribute of any executed inline script or style. The browser will only execute inline code that includes the correct nonce value.
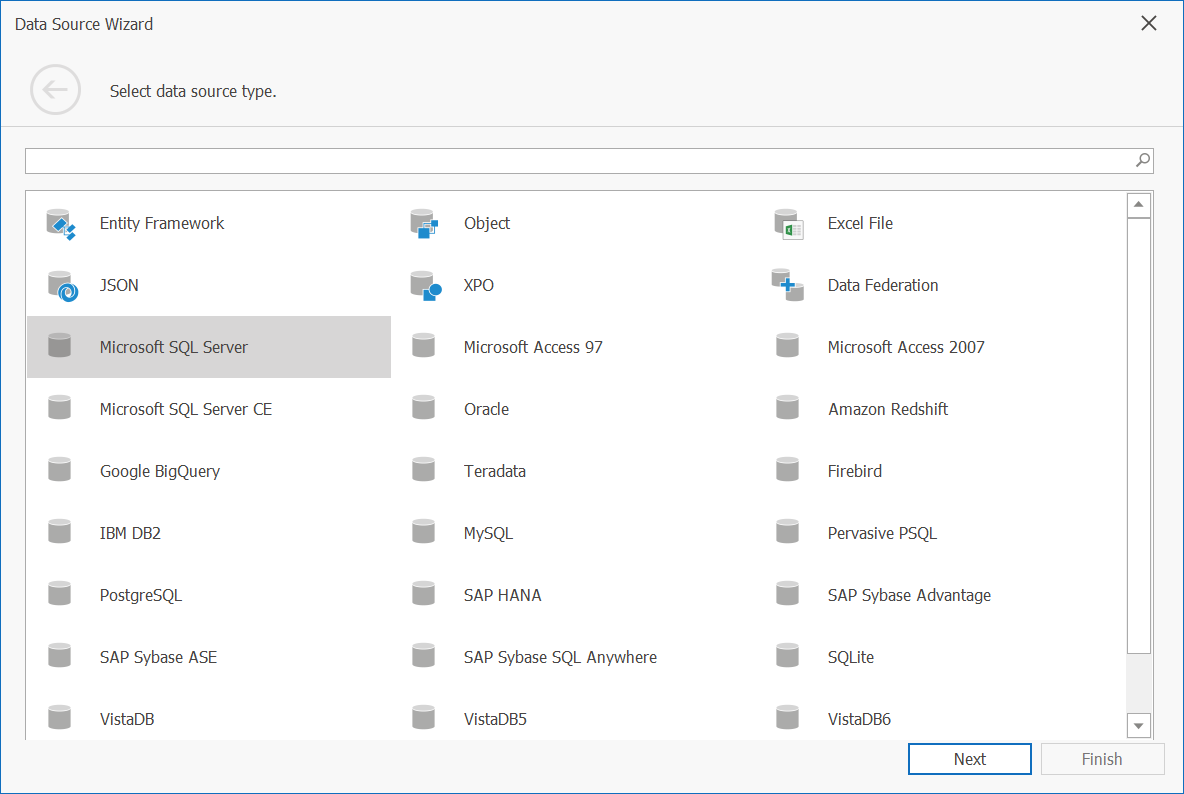
The Data Source Wizard Update
WinForms
Visual Studio Dashboard Designer
Released in v23.1
We will merge two first pages of our Data Source Wizard integrated into the DevExpress BI Dashboard Designer. Pages once used to select data source type and database provider will be replaced with a single page that displays a flat list of all supported data sources (with integrated search). The following screenshot illustrates the changes you can expect in our v23.1 release cycle (please note - this is an early mockup of the interface):
BI Dashboard Roadmap Survey 2023
Take our online survey to help us finalize our 2023 DevExpress BI Dashboard Roadmap.
We thank you in advance for your assistance. Should you have any questions or concerns, feel free to submit a support ticket via the DevExpress Support Center.
Free DevExpress Products - Get Your Copy Today
The following free DevExpress product offers remain available. Should you have any questions about the free offers below, please submit a ticket via the
DevExpress Support Center at your convenience. We'll be happy to follow-up.